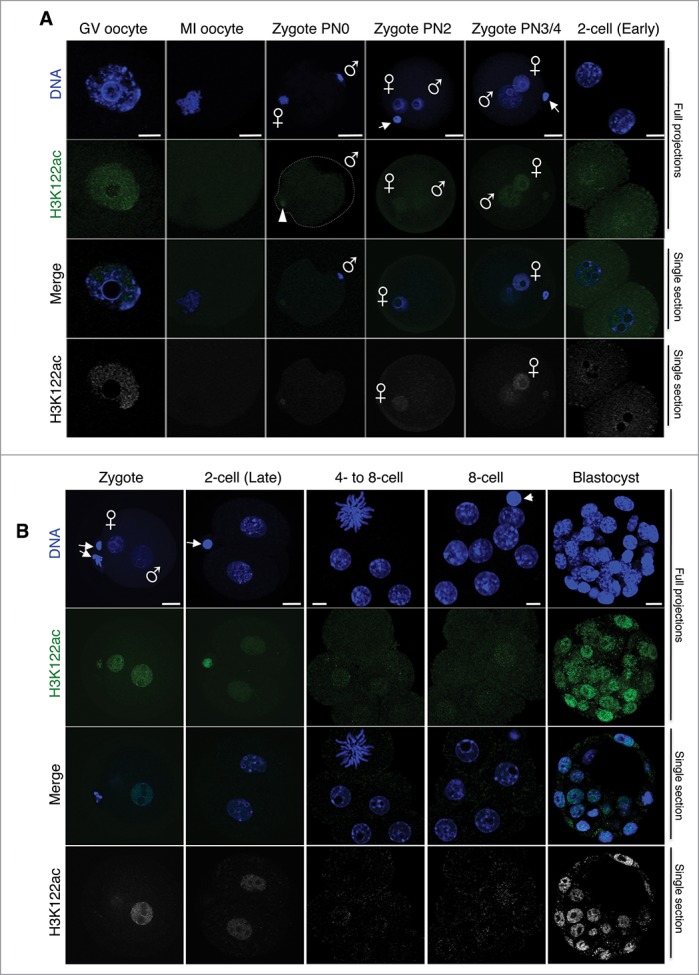
Figure 2.

H3K122ac is present at low levels in cleavage stage embryos. (A) H3K122ac was analyzed in oocytes and zygotes immediately after fertilization, freshly collected from natural matings. The top 2 panels show maximal projections of confocal Z-sections for H3K122ac (green) or DAPI (blue) of representative embryos of at least 16 analyzed per stage. The bottom panel shows a middle confocal section where the gray and blue channels are merged. When present, the polar body is indicated by an arrowhead. The male and female pronuclei are indicated. Scale bar is 12 μm. (B) Embryos at the indicated stages were freshly collected, fixed, stained with an H3K122ac (green) antibody, and analyzed using confocal microscopy. DNA is shown in blue. Shown are full projections of Z-sections taken every 1 μm (cleavage) or 2 μm (blastocyst). The bottom panel is the same channel for the merge shown on the third row, but showing the H3K122ac channel in gray scale. When present, the polar body is indicated by an arrowhead. The male and female pronuclei are indicated. At least 10 embryos from independent experiments were analyzed per stage. Embryos shown were imaged under identical conditions, thus fluorescence levels are directly comparable. Scale bar is 12 μm.
