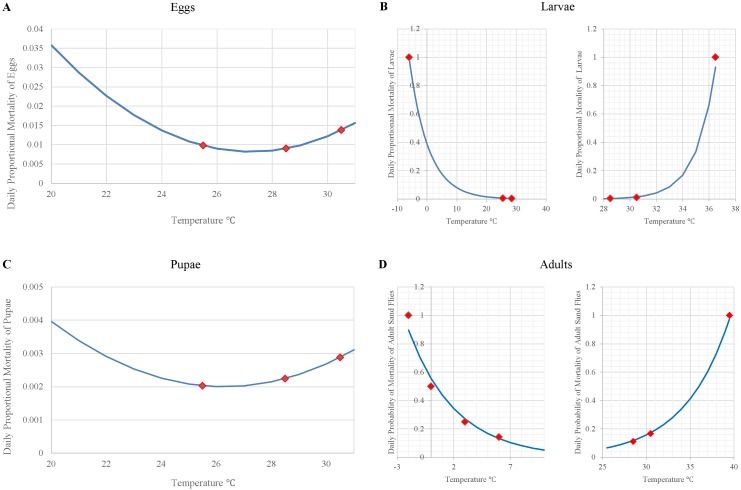
Fig 4. Curves representing the temperature-dependent natural mortality of sand fly stages.
(A) eggs (Eq 8), (B) larvae (Eqs 9 and 10), (C) pupae (Eq 11), and (D) adults (Eqs 12 and 13). Egg and pupal mortality are polynomial functional relationships whereas larval and adult mortality increases exponentially from the optimum temperatures for survivorship towards the upper and lower thermal limits. Red squares represent the data points used to generate the curves.

