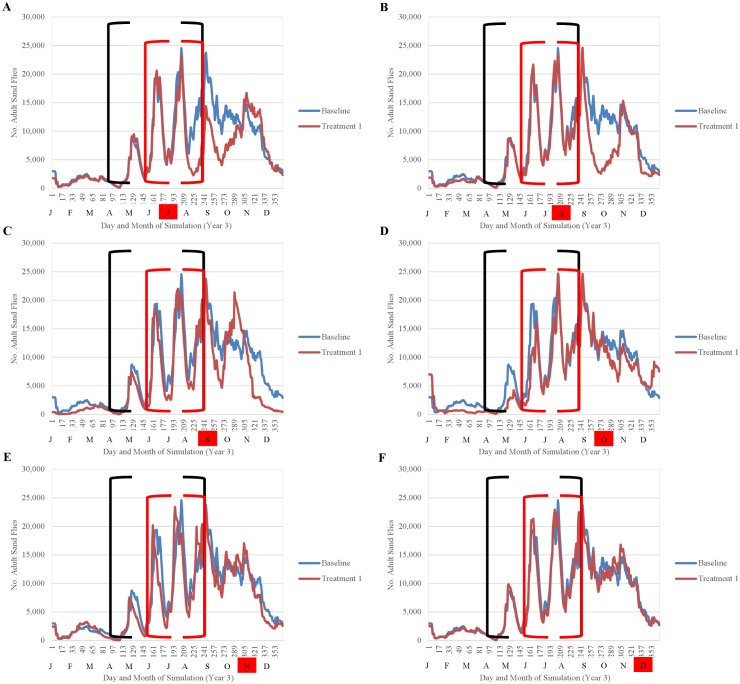
Fig 15. Comparison of the seasonality of adult sand flies observed during year 3 of simulation for treatments performed once annually July-December (A-F) and the baseline simulation (no treatment) (mean 10 replications).
Black brackets indicate April-August and the red brackets indicate the summer months of peak human exposure (June-August). Red boxes indicate the months of treatment application.

