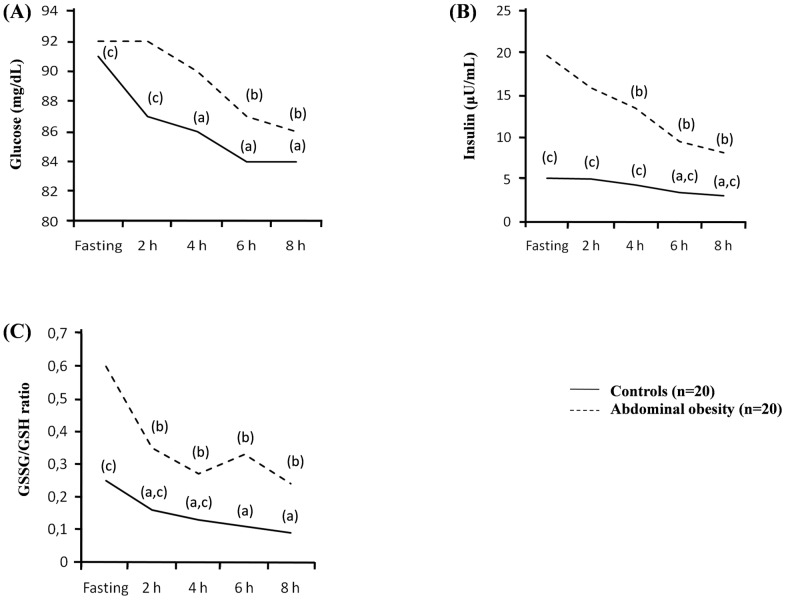
Fig 1. Plasmatic changes during the oral fat load test in control subjects and subjects with abdominal fat deposits.
(A) Glycemia during the oral fat load test. (B) Insulinemia during the oral fat load test. (C) GSSG/GSH ratio during the oral fat load test. (a) p < 0.05 fasting vs postprandial in control group. (b) p < 0.01 fasting vs postprandial in Abdominal obesity group. (c) p <0.01 control vs Abdominal obesity group.

