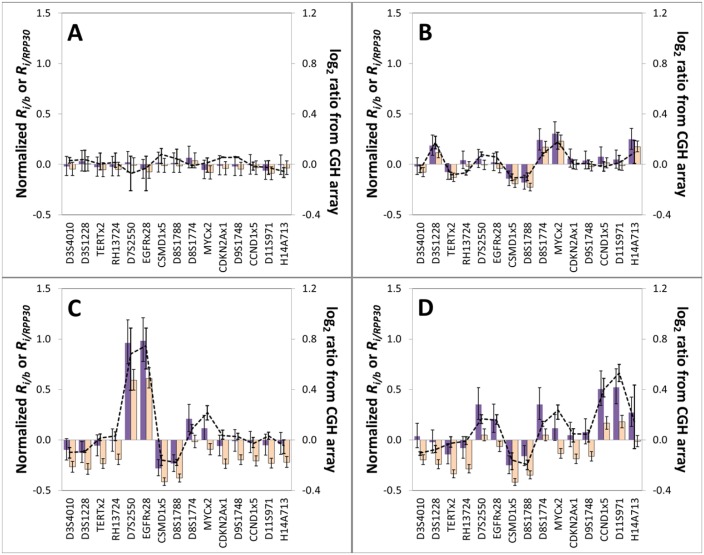
Fig 5. Comparison of CNAs measured within frozen tissue specimens by our multiplexed ddPCR method and by aCGH.
15 biomarkers within DNA extracted from four frozen tissue biopsies collected in a field study of the oral cavity of an oral cancer patient: A = Area 4 (normal connective tissue); B = Area 1 (OSCC-positive tissue); C = Area 2 (moderate to severe dysplasia); and D = Area 3 (OSCC-positive tissue). The log2 ratios from aCGH are the averaged values for the three or four probes that map closest to the biomarker interrogated by ddPCR (see Materials and Methods), with the error bars showing the respective high and low log2 ratios for these probes. Purple-filled bars are Ri/b—1 (normalized) values computed using our CNA-neutral benchmark as reference and orange-filled bars are Ri/RPP30−1 values computed using RPP30 as a single reference locus. Error bars represent a 95% confidence interval. Biomarkers have been sorted by chromosomal location (x-axis).

