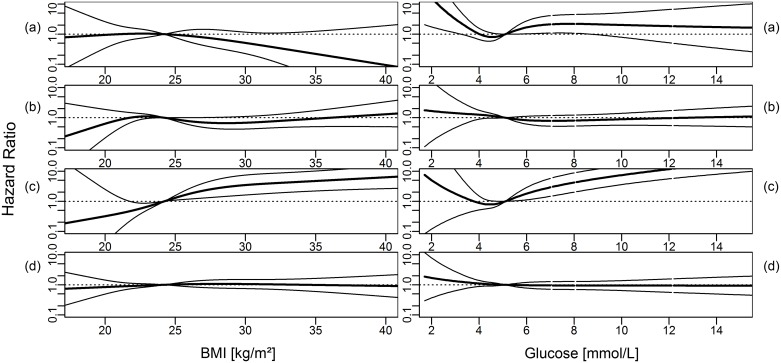
Fig 1. Hazard ratio (dark line, 95% CI: light lines) for cause-specific ESRD for body mass index (BMI) and blood glucose levels, modeled using cubic restricted splines.
(a) ADPKD, (b) vascular nephropathy, (c) diabetic nephropathy and (d) other diseases. Medians of metabolic parameters were used as reference. Models were adjusted for age, sex, smoking status and mutually adjusted for metabolic parameters (as linear terms, logarithmized for triglycerides and gamma-GT).

