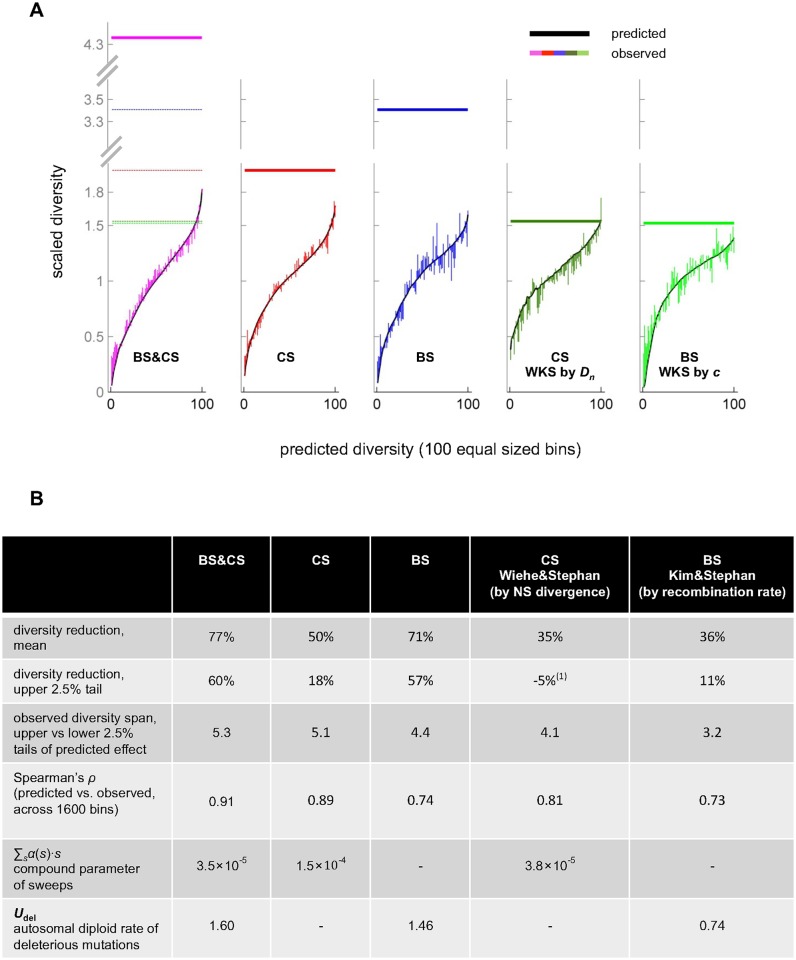
Fig 6. The impact of linked selection on scaled diversity levels.
(A) Observed scaled diversity levels stratified by model predictions. Shown here are the results based on our method with both background selection and classic sweeps (pink), background selection alone (blue) and classic sweeps alone (red), as well as for the Wiehe and Stephan (1993) [6] method for classic sweeps based on the density of non-synonymous substitutions (dark green) and the Kim and Stephan (2000) [10] method for background selection based on recombination rates (light green). The stratification is described in the text. Predicted levels are shown in black, the observed deviations from the predictions are shown as vertical lines, with the colors corresponding to different models, and the estimated scaled diversity levels in the absence of linked selection are shown as horizontal bars. (B) Summaries of the mean reduction and heterogeneity in scaled diversity levels based on the different methods and models. Also shown are estimates of compound selection parameters and the Spearman correlation between predicted and observed levels. (1) The negative value reflects the fact that the observed scaled diversity level is higher than the level predicted in the absence of linked selection.

