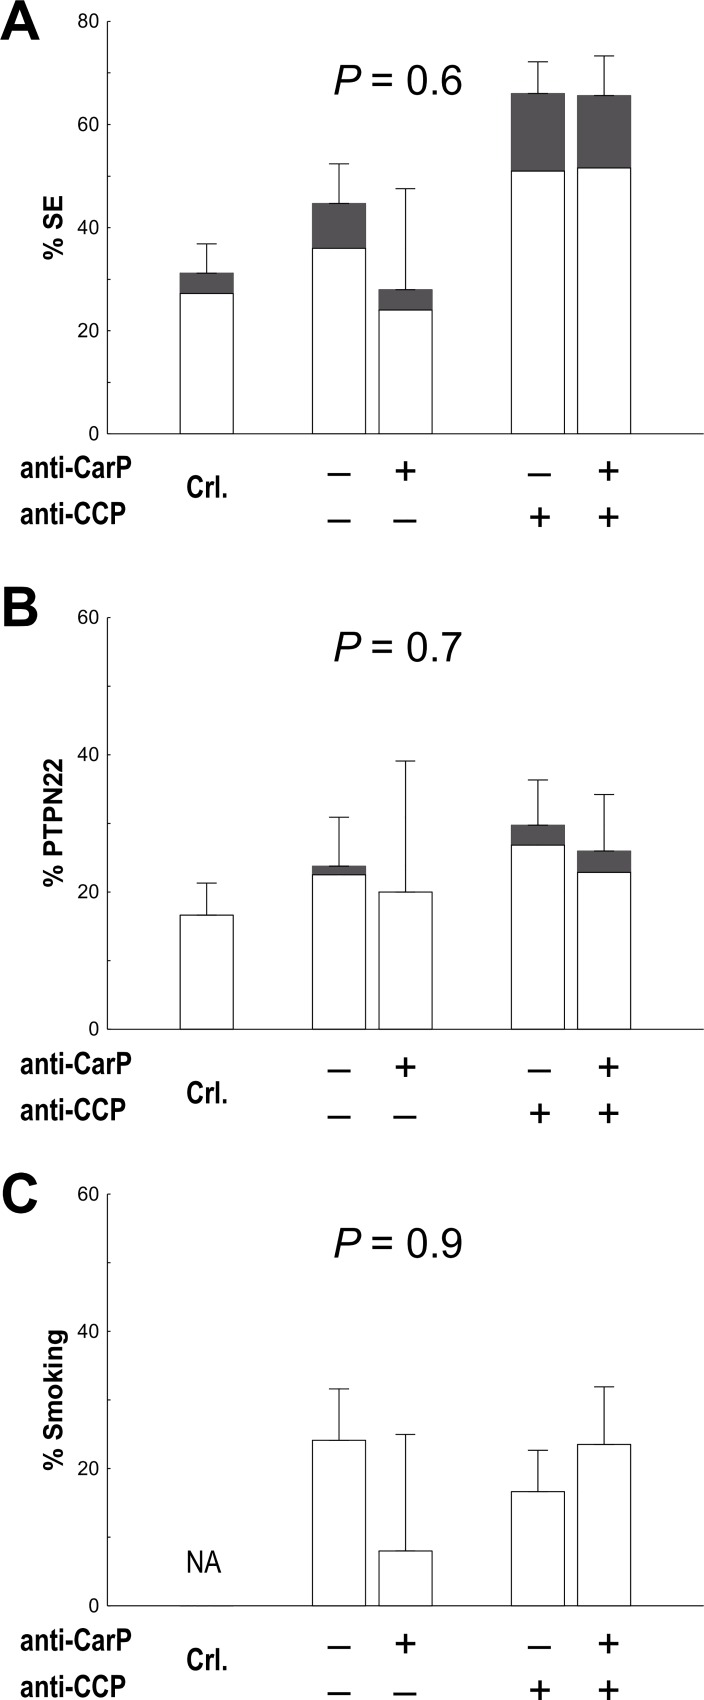
Fig 2. Stratified analysis of RA risk factors according to the anti-CarP and anti-CCP status.
Frequency of the A) HLA-DRB1 SE and B) PTPN22 R620W genotypes in the different strata. White fraction = heterozygotes, grey fraction = homozygotes. C) Frequency of ever smokers. Error bars represent 95% CI. Crl. = controls, NA = not available. P values were obtained with logistic regression analysis adjusted for gender, age of diagnosis and time of follow-up.

