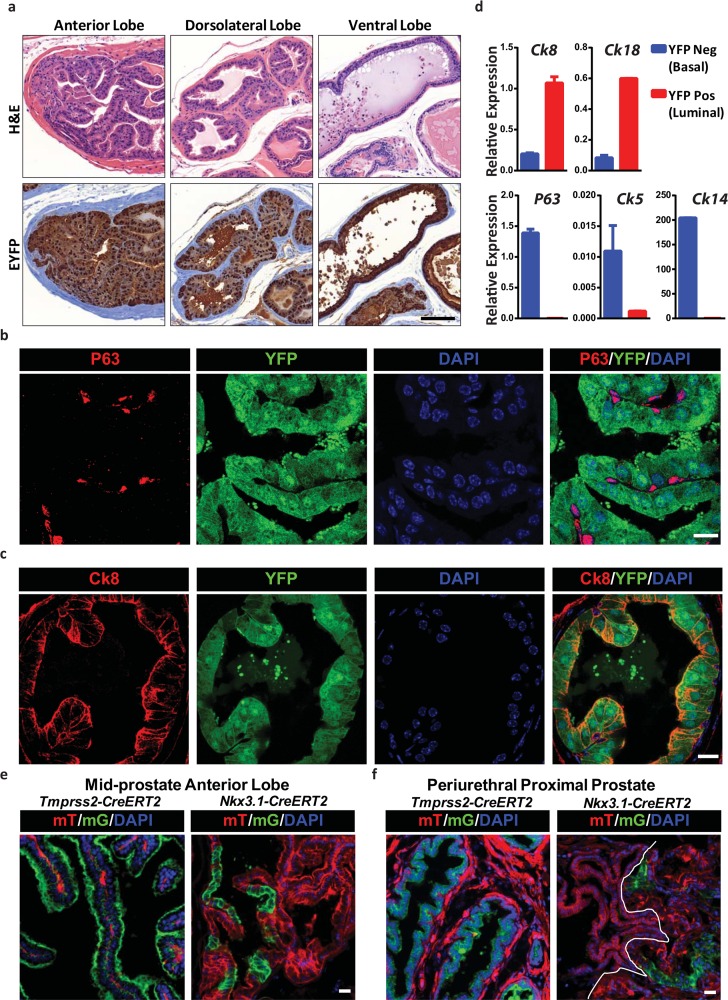
Fig 2. Prostate specific activity of Tmprss2-CreERT2 mice.
(a) H&E and YFP IHC of anterior prostate, dorsolateral prostate, ventral prostate in TY mice. Scale bar represents 100 μM. (b) IF stain of basal cell marker P63 with endogenous YFP and DAPI fluorescence in TY mice. Scale bar represents 20 μM. (c) IF stain of luminal cell marker Ck8 with endogenous YFP and DAPI fluorescence in TY mice. Scale bar represents 20 μM. (d) Quantitative RT-PCR analysis of basal (Ck5, Ck14, P63) and luminal (Ck8, Ck18) marker expression in YFP+ and YFP- epithelial cells. Basal cell markers are strongly expressed YFP- cells; luminal cell markers strongly expressed in YFP+ cells. Expression was normalized to Actin. Results are shown as mean ± SD. (e) Comparison of Tmprss2-CreERT2 with Nkx3.1-CreERT2 driven conversion of membrane tdTomato (mT) to membrane EGFP (mG) of the anterior prostate. Scale bar represents 50 μM. (f) Same as in (e) but in periurethral proximal prostate. These cells are tightly packed with scant cytoplasm. The white line in the Nkx3.1-CreERT2 mouse separates the anterior prostate from periurethral prostate. Scale bar represents 50 μM.

