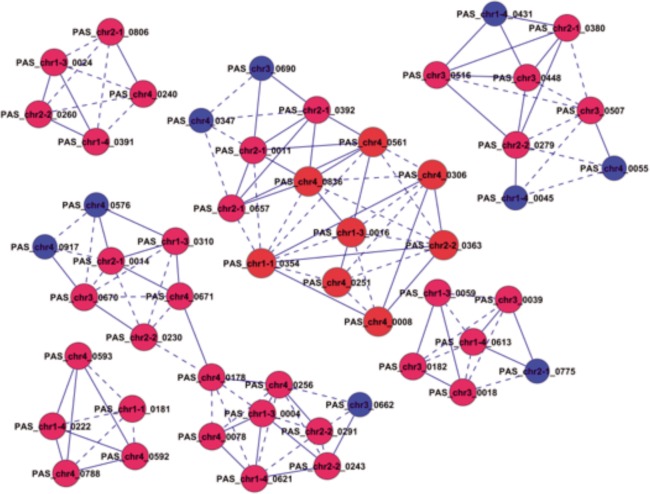
Fig 5. Co-expression network core of differential genes.
Time Point 3 to 5. Cycle nodes represent genes; the real line and dotted line between two nodes represent direct and indirect interactions between genes, respectively. The red nodes represent genes with the K-core value greater than or equal to 4, the blue nodes represent genes with the K-core value less than 4.

