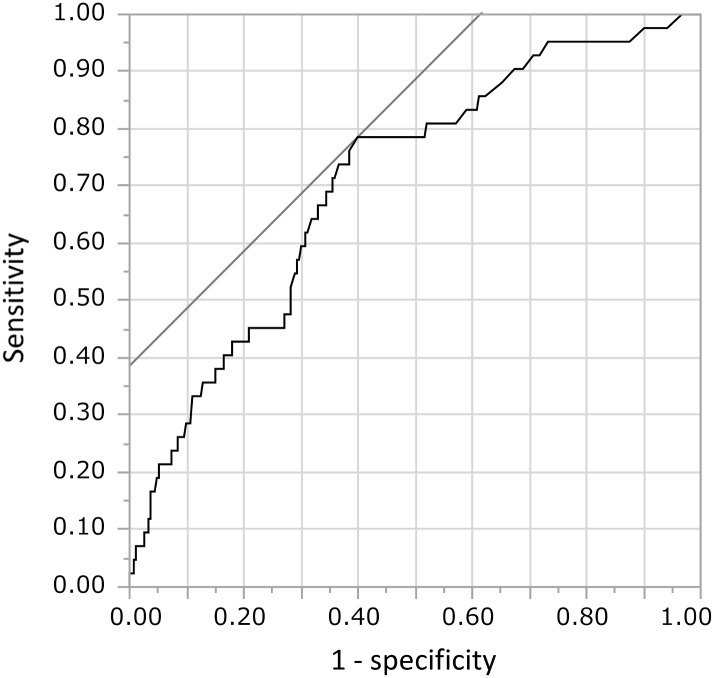
Fig 4. Receiver operating characteristics (ROC) curve for the median CRP values along the entire follow-up in predicting CKD.
Sensitivity and specificity were 78.6% and 60.1% at 3.6 mg/L, the most adequate cut-off point of the median CRP values along the entire follow-up. The area under the curve was 0.707.

