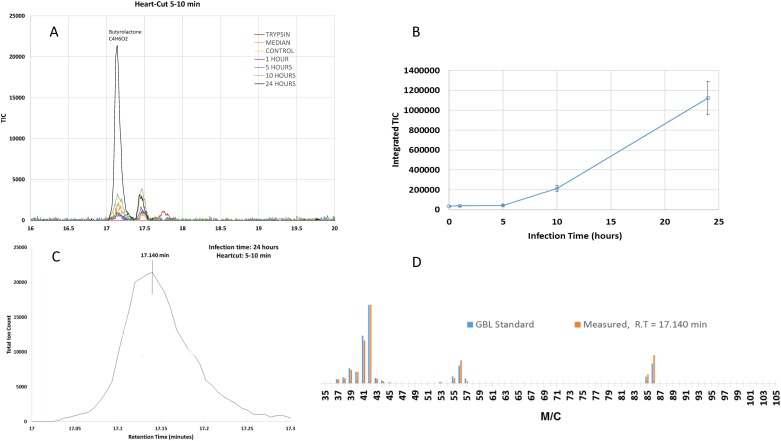
Fig 3. Examination of GBL release profile.
A. The GBL peak was identified from the chromatograms taken using the 5–10 min heartcut. A close-up view shows the peak intensity was very weak among all samples and the controls except for the 24 hpi one, for which the GBL peak exhibited a very large increase. B. Measurement of integrated TIC during different infection times of 0, 1, 5, 10, 24 hpi, A significant increase was detected at 24 hpi. C. The enlarged GBL peak (labelled with retention time) where the measured mass spectra were compared with the GBL standard mass spectrum as shown in D. D. Comparison of mass spectra collected at different retention times with the GBL standard mass spectrum from the NIST library.

