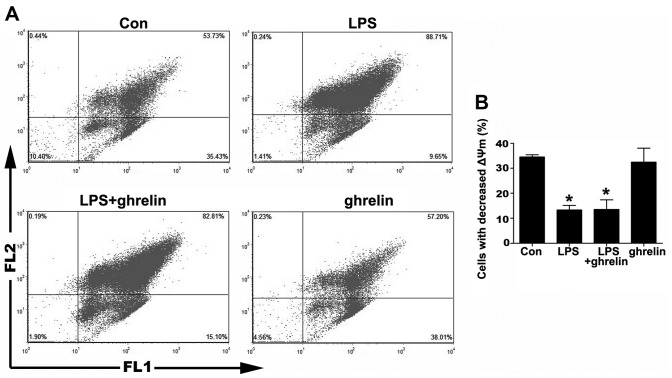
Figure 3.
Effects of drugs on mitochondrial transmembrane potential (ΔΨm) in neutrophils. Cells were pre-treated with or without 100 nM ghrelin for 1.5 h and then simulated with or without 100 ng/ml lipopolysaccharide (LPS) for 8 h. (A) Dot graphs show the flowcytometric ananlysis of the mitochondrial transmembrane potential (ΔΨm) of the LPS- and ghrelin-treated neutrophils. ΔΨm was then determined with the lipophilic dye, JC-1. (B) Quantitative analysis of neutrophils undergoing ΔΨm. *P<0.05 compared with the control.

