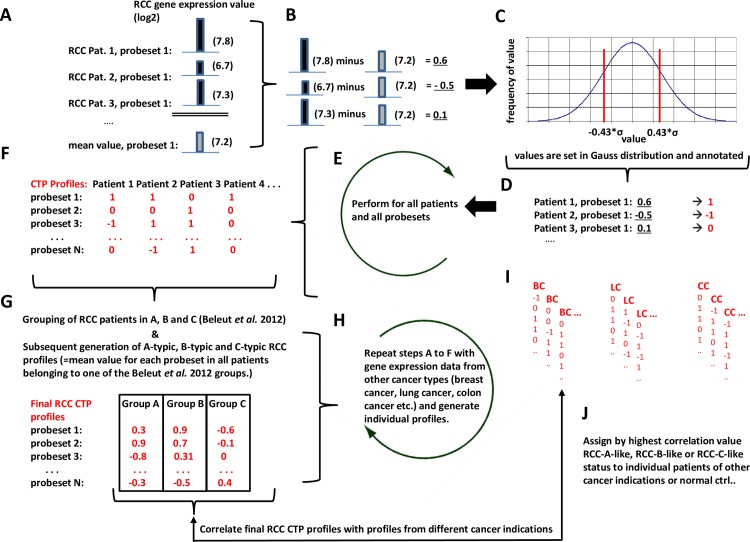
Fig 2. Workflow for generating RCC-CTPs.
A. Determination of the gene expression value (log2) of gene probe set 1 in all RCC samples tested and generation of the mean value for probe set 1 of the entire RCC tumor cohort (exemplified values are shown). B. Subtraction of the mean value from true expression value for probe set 1 of each patient. C. Distribution of the remaining deviation values from mean for probe set 1. D. Annotation of remaining deviation values from mean for probe set 1 as 1, -1 or 0 depending on their localization in the distribution. E. Steps A to D are performed for all probe sets of the gene expression microarray. F. Individual CTP profile for each patient given by a vector covering all expression values. G. Grouping of RCC patients into CTP-A, -B or -C according to Beleut et al. 2012; Determination of the CTP mean values of all gene probe sets for patient group A, group B and group C and generation of the final RCC CTP A, -B and -C target vectors. H. Gene expression data from other cancer types calculated according to steps A to F and generation of patient-specific CTP-vectors. I. Correlation of RCC CTP-A, -B and -C target vectors from step G with patient-specific CTP of other cancer types derived from step H. (BC) breast cancer patients; (LC) lung cancer patients, (CC) colon cancer patients. J. Assigning a patient or control to tumor subgroup according to the CTP with the highest correlation.

