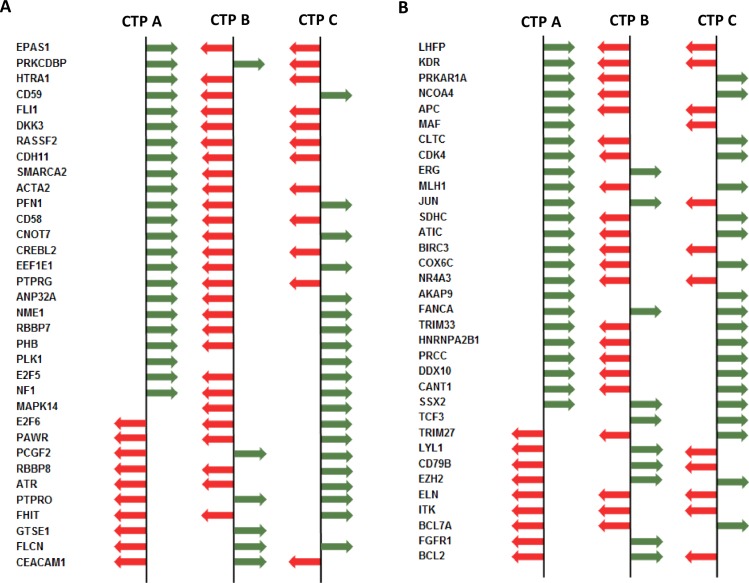
Fig 5. CTP profiles of the different cancer types using randomly picked tumor suppressor or oncogenes.
Shown are best descriptors of gene expression deviations from the mean of randomly selected tumor suppressor genes (A) and oncogenes (B) encompassing different cancer types. For a detailed overview illustrating all expression deviations including genes showing no deviations from the mean, see S4 and S5 Tables. Red: relative gene expression deviation is lower than the mean expression, Green: relative gene expression deviation is higher than the mean expression. CTPs differ by the overall relative gene expression deviations. The entirety of expression deviations from the mean of genes, not that of one single gene is relevant for affiliating one distinct tumor to CTP-A, -B or -C.

