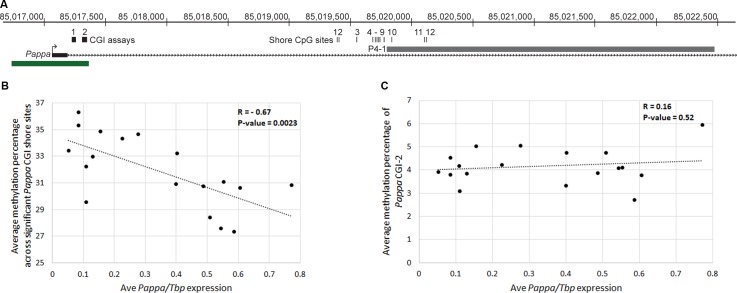
Fig 5. In vivo methylation analysis of the Pappa CGI and CGI shore.
(A) The first exon of the Pappa gene is shown in relation to a conserved CGI (green box) and the P4-1 looping fragment (gray box). The location of the 12 shore CG dinucleotides investigated in this report are indicated and numbered, as are the regions covered by the two pre-made CGI pyrosequencing assays. The CGI assays each examined 5 CG dinucleotides within the island. (B) A scatterplot demonstrating a statistically significant negative correlation between 6 week MEC Pappa expression (x-axis) and shore methylation (y-axis; Pearson correlation coefficient, R, = -0.67, n = 18, p-value = 0.0023) is shown. Shore methylation values were obtained by averaging the absolute methylation percentages of the 6 significant shore sites (Sites 1, 3, 6–9) for each individual sample. A linear trend line is shown with the dotted line (slope = -7.88). (C) No correlation was observed between 6 week MEC Pappa expression (x-axis) and CGI methylation (y-axis; Pearson correlation coefficient, R, = 0.16, n = 18, p-value = 0.52). CGI methylation values were obtained by averaging the absolute methylation percentages of the 5 sites examined by the CGI-2 assay for each individual sample. A linear trend line is shown with the dotted line (slope = 0.544).

