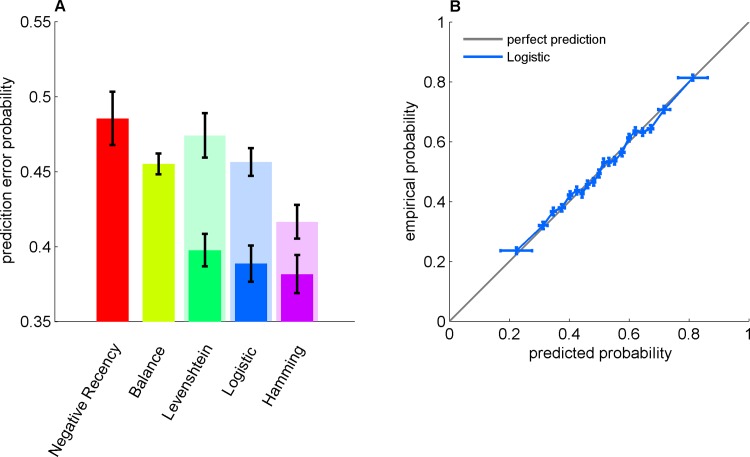
Fig 4. Predicting choices in the RSG task.
A. Prediction-error probability for different models: Negative Recency (red), Balance (mustard), Levenshtein (green), Logistic (blue) and Hamming NN (purple). Dark and light colors correspond to the heterogeneous versions (a different set of parameters for each participant) and homogeneous versions (a single set of parameters for all participants) of the models, respectively. The model memory lengths (L) were chosen to minimize the generalization error: Negative Recency, L = 1; Balance, L = 7; Heterogeneous Levenshtein, L = 3; Homogeneous Levenshtein, L = 4; Heterogeneous Logistic, L = 3; Homogeneous Logistic, L = 8; Heterogeneous NN, L = 4; Homogeneous NN, L = 8. B., The predicted probability for Heads versus the empirical one (in the test set) for the logistic model is depicted in panel B (blue) over the diagonal (gray). B. Empirical probability of H as a function the predicted probability of H. The data was divided into 20 equally populated bins according to the predicted probability of H and the fraction of H was computed for each bin. Error bars represent the SEM.

