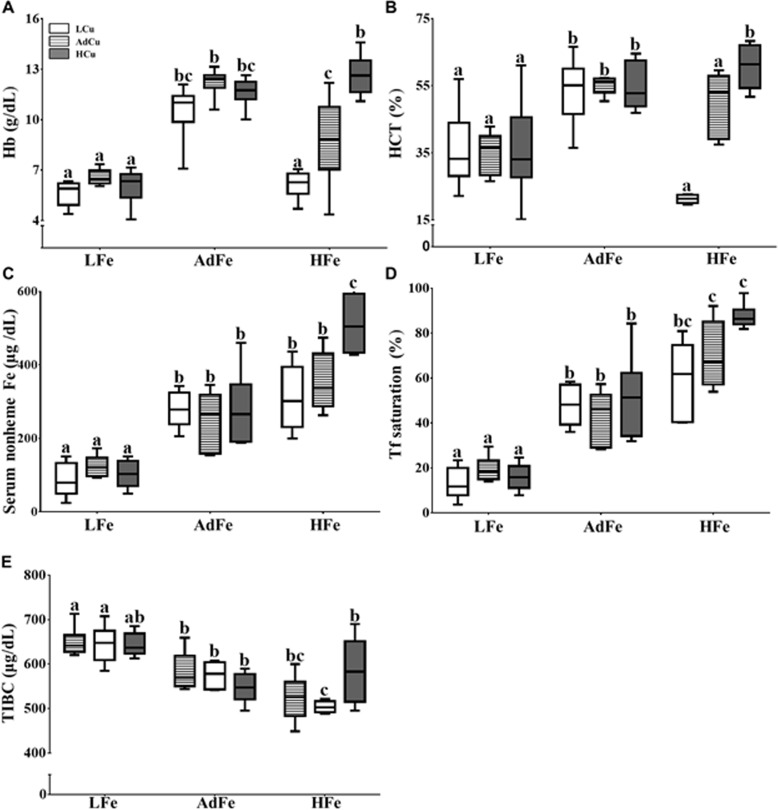
Fig 2. Consumption of the low- and high-iron diets altered hematological parameters.
Hemoglobin (Hb) (A) and hematocrit (Hct) (B) were determined from whole blood collected from experimental animals at sacrifice. Serum nonheme iron (C), serum transferrin saturation (D) and total iron-binding capacity (TIBC) (E) were also quantified. Labeled means without a common letter differ (p<0.05). n values and abbreviations used are the same as in Fig 1. The Box-and-Whisker plots indicate the following: the minimum value (the lower whisker), the lower quartile, the median, the upper quartile and the maximum value (the upper whisker). 2-way ANOVA factor analysis results are as follows: hemoglobin (Fe: p<0.0001; Cu: p<0.0001; Fe X Cu: p<0.0001); hematocrit (Fe: p<0.0001; Cu: p<0.0001; Fe X Cu: p<0.0001); serum nonheme iron (Fe: p<0.0001; Cu: p<0.001; Fe X Cu: p<0.0001); serum transferrin saturation (Fe: p<0.0001; Cu: p<0.0001; Fe X Cu: p<0.001) and TIBC (Fe: p<0.0001; Cu: ns; Fe X Cu: p<0.001). ns, not significant.

