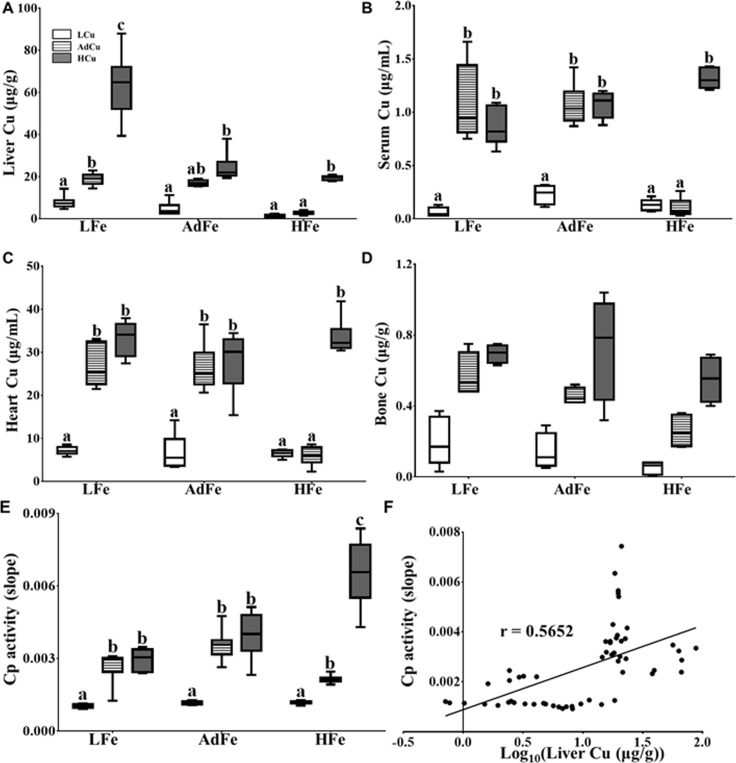
Fig 5. High-iron feeding resulted in severe tissue copper depletion and reduced Cp activity.
The copper concentration in liver (A), serum (B), heart (C) and bone (D) was determined by ICP-MS. Cp (i.e. amine oxidase) activity was also measured in serum samples (E). The correlation between Cp activity and liver copper concentrations (log10) was calculated using Pearson product-moment correlation analysis (F). The line of best fit is shown along with the correlation coefficient (r) (p<0.0001). Labeled means without a common letter differ (p<0.05). n values and abbreviations used are the same as in Fig 1. The Box-and-Whisker plots indicate the following: the minimum value (the lower whisker), the lower quartile, the median, the upper quartile and the maximum value (the upper whisker). 2-way ANOVA factor analysis results are as follows: liver copper (Fe: p<0.0001; Cu: p<0.0001; Fe X Cu: p<0.0001); serum copper (Fe: p<0.05; Cu: p<0.0001; Fe X Cu: p<0.01); heart copper (Fe: p<0.0001; Cu: p<0.0001; Fe X Cu: p<0.0001); bone copper (Fe: p<0.01; Cu: p<0.0001; Fe X Cu: ns); and Cp activity (Fe: p<0.0001; Cu: p<0.0001; Fe X Cu: p<0.0001).

