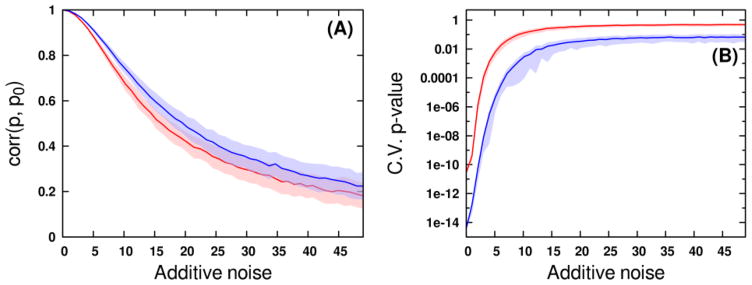
Fig. 3.
(A) Decrease of correlation between estimated loadings (p) and true loadings (p0) occurs as varying degrees of noise are added to the Coffees (red) and Media (blue) data matrices. Light shaded regions indicate confidence intervals of plus or minus one standard deviation from the mean correlation. A value of 1X additive noise corresponds to a noise standard deviation equaling 0.002 times the data matrix l2 norm. (B) Increase of p values from CV-ANOVA OPLS-DA validation as varying degrees of noise are added to the Coffees (red) and Media (blue) data matrices. Light shaded regions indicate confidence intervals of plus or minus one standard deviation from the median p value.

