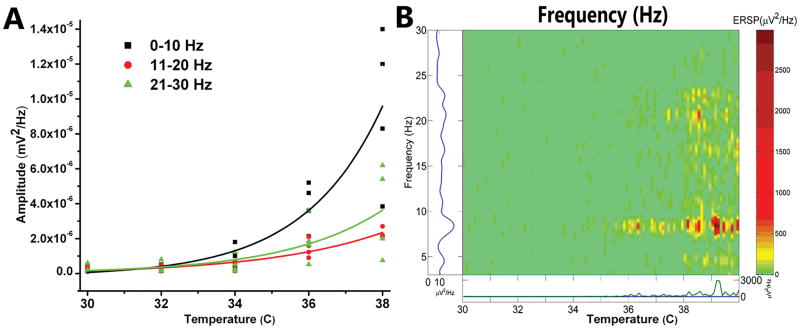
Figure 1. Recordings of population responses in PPN.
A. Graph of frequencies, 0–10 Hz black squares, 11–20 Hz red circles, and 21–30 Hz green triangles, as the slices were warmed from 30°C to 38°C. Amplitude at each frequency is plotted for four different slices, with best-fit lines for each frequency range. B. Event related spectral perturbation (ERSP) of one slice showing changes in frequency (left axis) during changes in temperature (horizontal axis) and density of activity (right axis color scale) (Delorme and Makeig, 2004). Note that, in the absence of stimulation or drug superfusion, increasing temperature led to an increase in higher frequency spontaneous activity. Significant increases in beta activity were not evident until the slice was warmed above 36°C (Simon, et al., 2010; Kezunovic, et a., 2011).

