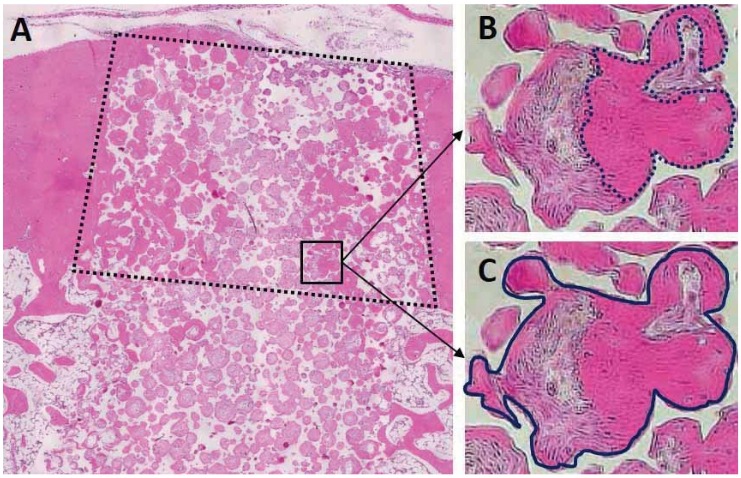
Figure 4. Schematic drawing of hstomorphometric analysis. The ratio of bone formation was measured in the cortical bone area (A, dashed box). It was calculated as the ratio of the area of newly formed bone (B, inside the dotted line) to that of the total regenerated tissue (C, inside the solid line).

