Figure 7.
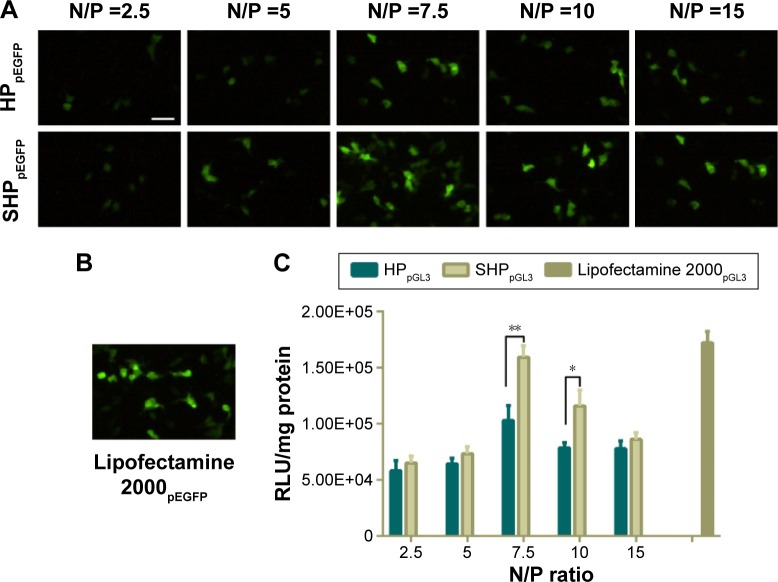
In vitro transfection efficacy of HPpDNA/SHPpDNA.
Notes: Fluorescent images of the transfection efficiency of HPpEGFP/SHPpEGFP (A) and lipofectamine 2000pEGFP (B). (C) Luciferase assay of HPpGL3, SHPpGL3, and lipofectamine 2000pGL3. Data are shown as the mean ± SD (n=3). *P<0.05, **P<0.01. Scale bar, 100 µm.
Abbreviations: RLU, relative light units; SD, standard deviation.

