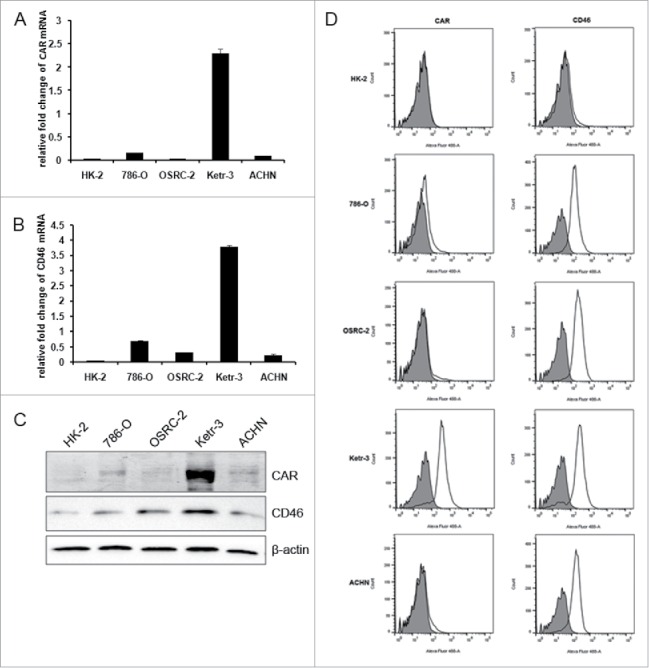
Figure 1.

The expression profiles of CAR and CD46 in renal cancer cells. The relative CAR and CD46 mRNA in renal cancer cells 786-O, OSRC-2, Ketr-3, ACHN and human renal tubular epithelial cell HK-2 were detected by qRT-PCR (A&B). The value was normalized to that of GAPDH. (C) Immunoblotting assay was performed to measure CAR and CD46 protein. β-actin was used as loading control. (D) Cell surface expression of CAR and CD46 in human renal cells and normal renal cells were evaluated by flow cytometry. Open traces represent signals and shaded traces represent negative controls.
