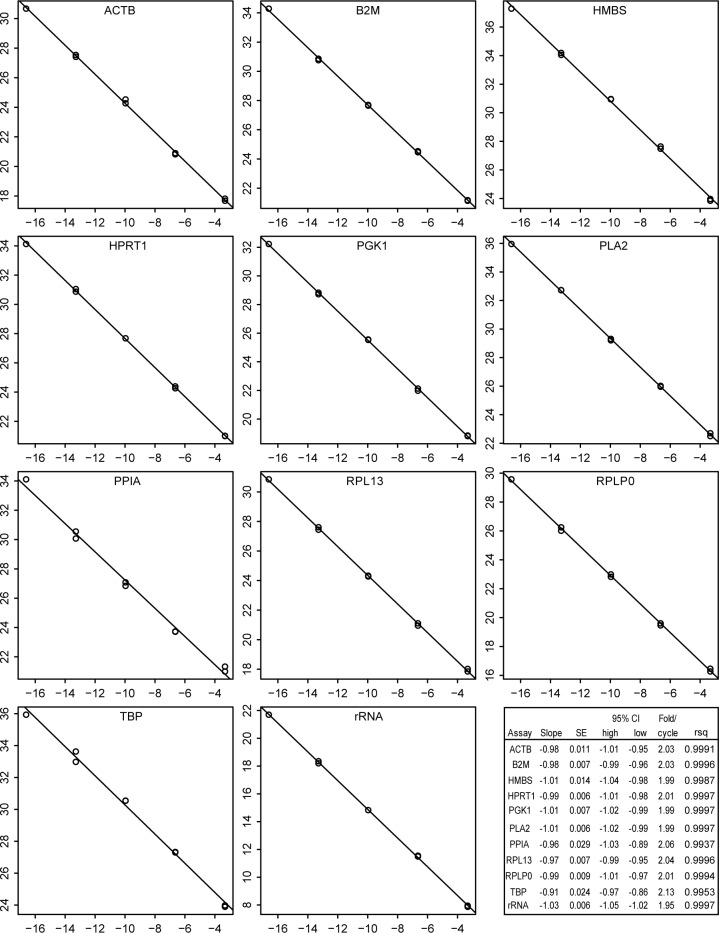
Fig 3. Linear regressions for efficiency of qPCR assays.
Serial ten-fold dilutions of HD11 cell line RNA were analysed in duplicate for each candidate reference transcript. The Ct (y axis) were plotted against the log2 of the relative RNA concentrations (x axis). Names of transcripts are at the top of each graph. The inset shows the results of linear regression. SE is the standard error of the slope; CI indicates the 95% confidence interval; fold/cycle is the efficiency and RSq is the R squared value.

