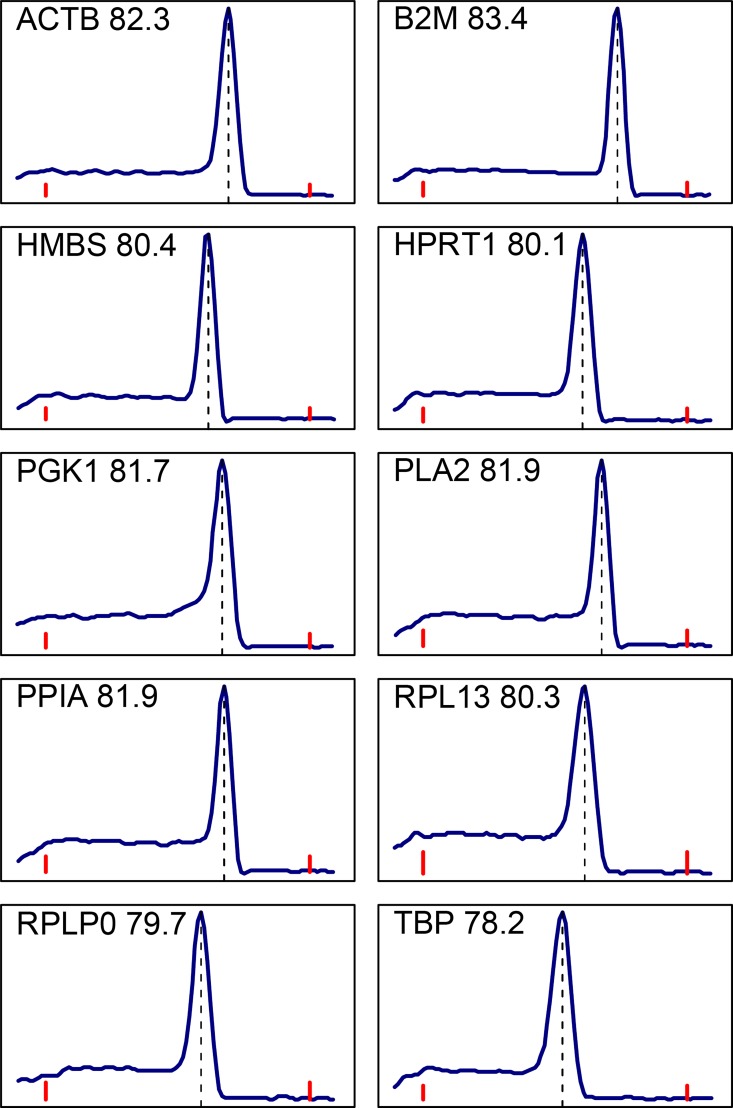
Fig 4. Melting curves of reference gene PCR products following SYBR Green assays.
Blue curves show the rate of change of fluorescence as a function of temperature. Red bars indicate 65 and 90°C. The peak temperature for each curve is given next to the transcript name and is indicated with a vertical dashed line.

