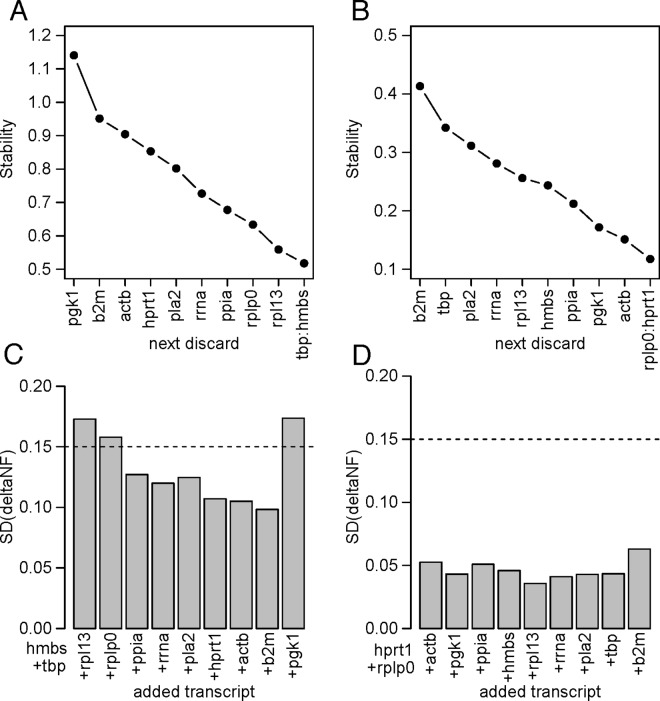
Fig 5. geNorm stepwise analysis of TaqMan analyses.
Left (A, C), tissue panel; right (B,D), fibroblast/flu experiment. The upper graphs (A,B) show the change in stability measure [5] after eliminating the least stable gene, which is indicated on the x axis, at each step. The lower graphs (C,D) show the standard deviations of the differences in sample normalisation following successive additions of reference genes to the pool. Lowering of the bar is a measure of the improvement obtained by adding the indicated gene to the pool. The dashed line shows the 0.15 cut off level suggested as a criterion by Vandersompele [5] to stop adding genes.

