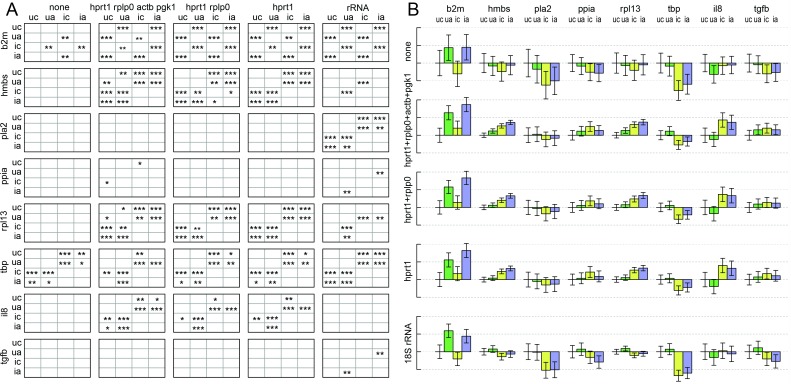
Fig 6. Effect of reference genes on detection of differential expression in an influenza-infected fibroblast experiment.
(A) The title above each column indicates the set of genes used as reference genes for normalisation. Each row shows the results of statistical analysis for the gene indicated to the left. Experimental groups labelled 'u' or 'i', for uninfected and infected, and 'a' or 'c' for preincubation with or without IFNα. Asterisks indicate p values for rejection of the null hypothesis that a gene is not differentially expressed in the groups indicated by row and column labels; *** = p<0.001, ** = p<0.01, * = p<0.05. (B) Estimated transcript levels relative to the uninfected control without IFNα. Dotted lines are at unit log2 intervals, representing two-fold changes. Bars represent means of biological replicates, with 95% confidence intervals indicated by error bars. Annotations show the transcripts used for normalisation (left margin), the transcripts assayed (above) and the treatment, encoded as above.

