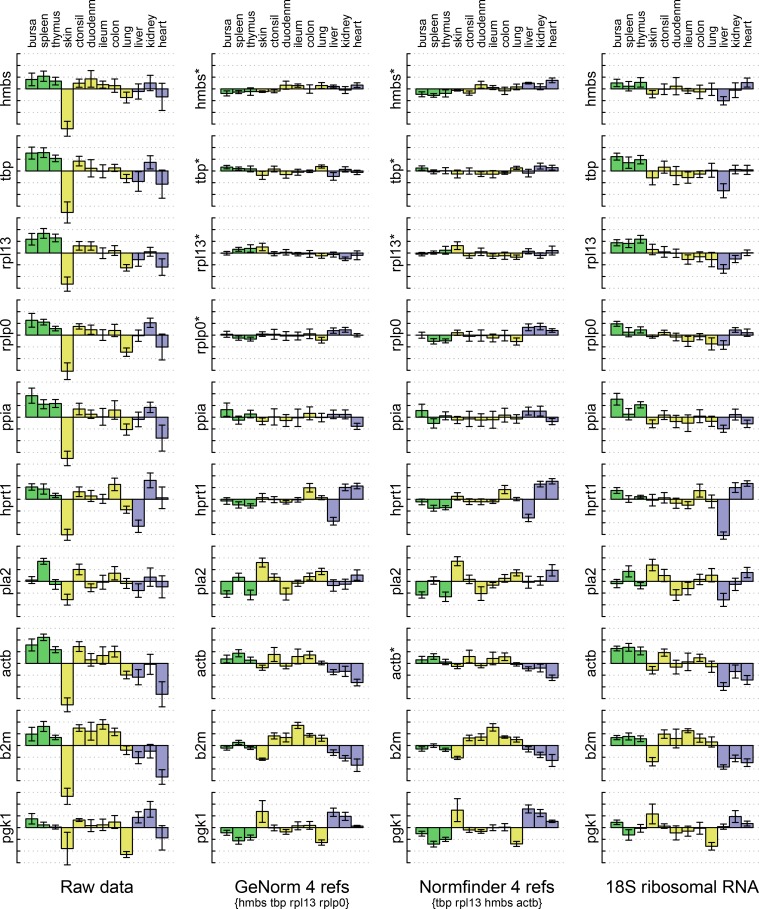
Fig 7. Transcript levels of candidate reference genes in tissues.
Bars are means from samples from six birds, relative to the mean across tissues, plotted on a log2 scale. Dotted lines are at unit intervals, equivalent to 2-fold differences. Error bars are ± one standard deviation in each group, without pooling of variances. The left column shows un-normalised data. The remaining columns show the same data after normalisation with the reference genes indicated beneath, or with ribosomal RNA on the right. Measured genes are indicated to the left of each plot, marked with an asterisk where they were among those used for normalisation. Tissues are identified at the top. Colours of bars distinguish tissues with different categories of immunological function.

