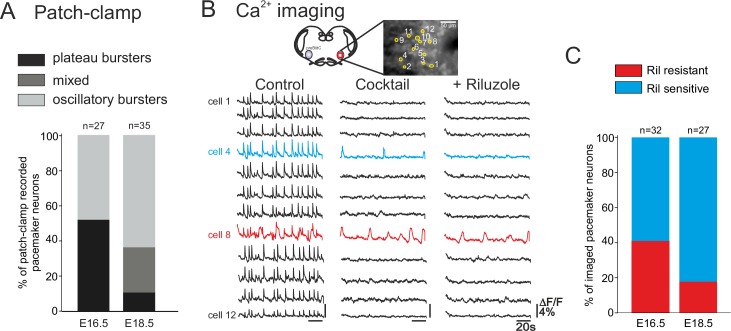
Figure 5. Developmental changes in inspiratory network pacemaker composition.
(A) Bar histograms indicating the mean proportions (as% ) of individual pacemaker neuron subtypes recorded with patch-clamp at E16.5 (n = 27) and E18.5 (n = 35). Plateau bursting neurons, black shading; mixed plateau/oscillatory bursters, dark gray; oscillatory bursting neurons, light gray. (B) Calcium imaging protocol (see also Figure 1) to test the sensitivity of the preBötC pacemaker neuron subpopulation to INaP blockade at E16.5 and E18.5. Calcium transients in 12 monitored inspiratory neurons at E16.5 in control conditions (left column), after synapse blockade (middle column), then under additional exposure to 10 µM riluzole (right column). Black traces correspond to non-pacemaker neurons (i.e., inactive under cocktail); the blue trace denotes a pacemaker neuron whose spontaneous activity was subsequently blocked under riluzole (i.e., an INaP-dependent pacemaker); the red trace corresponds to a pacemaker neuron that remained rhythmically activity under both cocktail and riluzole (i.e., an ICAN-dependent pacemaker). (C) Bar histograms representing the proportions of riluzole-sensitive (blue bar) vs riluzole-resistant (red bars) neurons detected at E16.5 and E18.5. Note the higher proportion of riluzole-sensitive (INaP-dependent) pacemaker neurons at the later embryonic stage.

