
Figure 6. The balance between simulated ICAN and INaP in silico can determine pacemaker discharge phenotype.
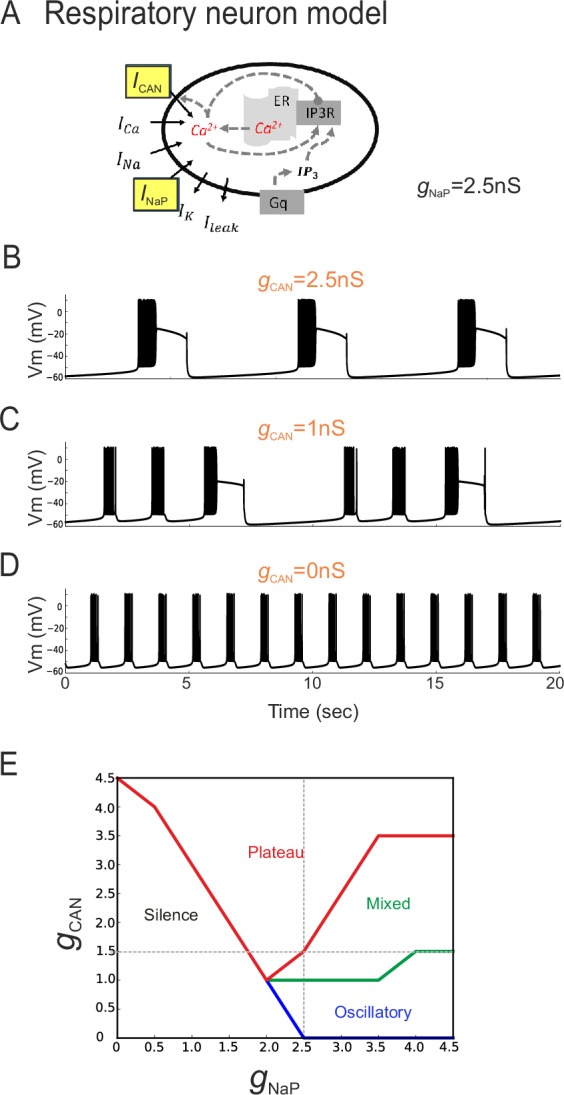
(A) Computational model of an inspiratory pacemaker neuron with the main burst-generating currents ICAN and INaP highlighted in yellow. For other abbreviations, see Material and methods and (Toporikova et al., 2015). (B–D) Model neuron voltage traces obtained with INaP conductance (gNaP) held constant at 2.5 nS and gCAN set to different steady state values (indicated in orange). Depending on gCAN magnitude, the model neuron generated plateau bursting discharge (B, gCAN = 2.5 nS), a mixed firing pattern (C, gCAN = 1 nS) or a rhythmic oscillatory burst pattern (D, gCAN = 0 nS). (E) Graph showing the type of model neuron discharge as a function of the proportions of gNaP and gCAN magnitudes. The gray dashed lines correspond to the values of constant gNaP and gCAN used, respectively, in the variable gCAN simulations illustrated in (B-D) and in complementary simulations in which INaP was varied with gCAN held constant (data not shown). Depending on the balance between gNaP and gCAN amplitudes, the model neuron could exhibit the three different patterns observed with patch-clamp recordings in vitro.