
Figure 3.
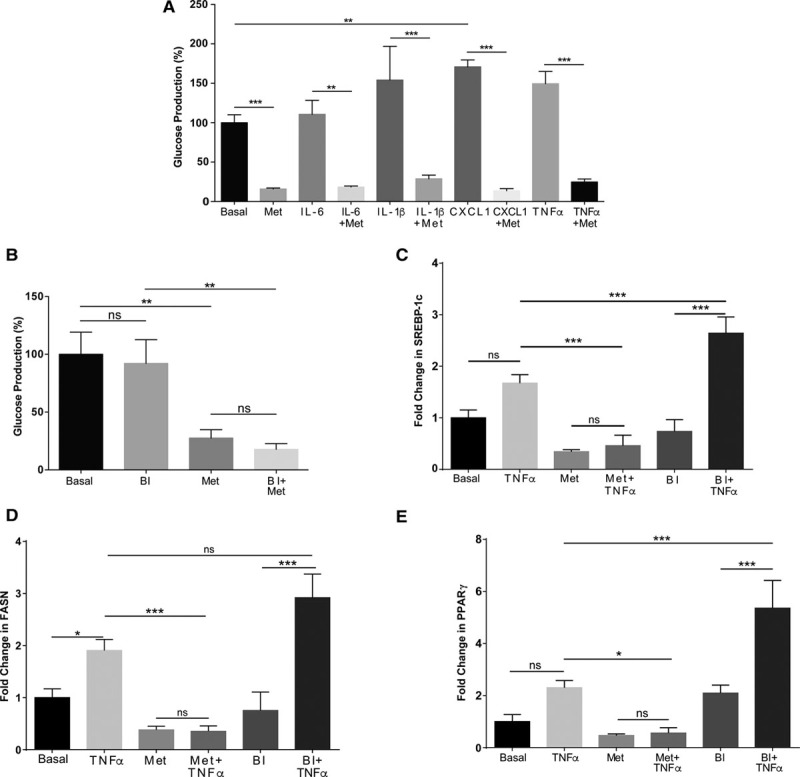
Effects of cytokines on glucose production and lipogenic gene expression in primary hepatocytes. A and B, Primary hepatocytes were treated with/without metformin (2 mmol/L), interleukin (IL)-6 (5 ng/mL), IL-1β (10 ng/mL), chemokine (C-X-C motif) ligand (CXCL) 1 (100 ng/mL) and tumor necrosis factor (TNF)-α (10 ng/mL) for 12 h, and glucose production was measured by GAGO (glucose [glucose oxidase]) assay as described in the Methods section of this article. C–E, Primary hepatocytes were treated with or without 10 ng/mL tumor necrosis factor (TNF)-α, 2 mmol/L metformin, and 10 μmol/L BI605906 for 8 h followed by cell lysis, RNA extraction, and preparation of cDNA for real-time polymerase chain reaction using primer sets for individual genes shown as described in the Methods section of this article. FASN indicates fatty acid synthase; PPAR, peroxisome proliferator–activated receptor; and SREBP, sterol regulatory element-binding protein.