
Figure 4.
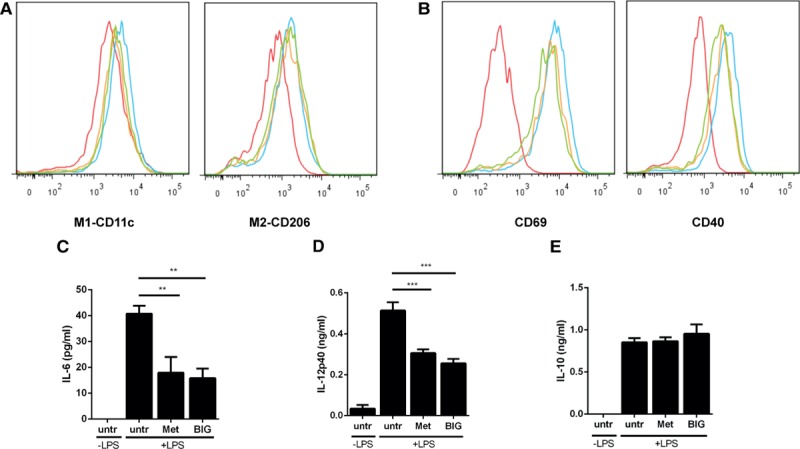
Effect of metformin and its analogue biguanide on bone marrow–derived macrophages: phenotypic markers and cytokine secretion. A, Macrophages were treated with/without metformin (2 mmol/L) or biguanide (BIG 2 mmol/L) to determine the effect on the M1 and M2 phenotypes of macrophages, which was measured by flow cytometry for CD11c and CD206 expression. The colors denote the following: red, undifferentiated; blue, differentiated, untreated; orange, differentiated, metformin; green, differentiated, BIG. B, Macrophages were treated with/without metformin (2 mmol/L) or biguanide (BIG, 2 mmol/L) to determine the effect on activation in response to 100 ng/mL lipopolysaccharide (LPS), which was measured by studying CD69 and CD40 expression. Histograms are representative of n=4. The colors denote the following: red, unactivated; blue, activated, untreated; orange, activated, metformin; green, activated, BIG. C–E, Macrophages were treated with/without metformin (Met) or BIG (2 mmol/L) to determine the effect of these drugs on IL-6 (C), IL-12p40 (D), and IL-10 (E) production (n=4).