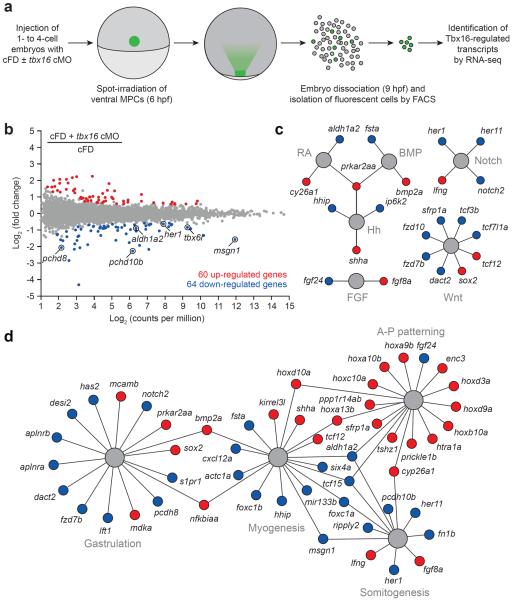
Figure 2. Optochemical analysis of the Tbx16-dependent transcriptome in trunk somite progenitors.
(a) cMO-based profiling of the Tbx16 transcriptome in ventral margin-derived MPCs. (b) Whole-transcriptome comparison of genes expressed in the targeted MPCs after cFD or cFD/tbx16 cMO photoactivation. Differentially expressed genes were identified by EdgeR statistical analysis (fold-change ≥ 1.5 and false discovery rate < 0.01). Tbx16 targets identified in a previous microarray studies19,20 are circled. (c) Tbx16-regulated genes that participate in developmental signaling pathways. (d) Tbx16-regulated genes with established roles in gastrulation, myogenesis, somitogneesis, and anterior-posterior patterning. Functional networks depicted in c and d are based on gene descriptions available through Ingenuity Pathway Analysis (IPA) tools and previous studies, and genes that are up- or downregulated upon loss of Tbx16 function are depicted as red or blue circles, respectively. IPA gene set terms and statistical enrichment values: gastrulation (“epithelial-mesenchymal transition”; P-value = 3.97E-06), myogenesis (“formation of muscle”; P-value = 1.01E-09), somitogenesis (“development of somites”; P-value = 1.85E-06), and anterior-posterior patterning (“patterning of rostrocaudal axis”; P-value = 8.18E-13).

