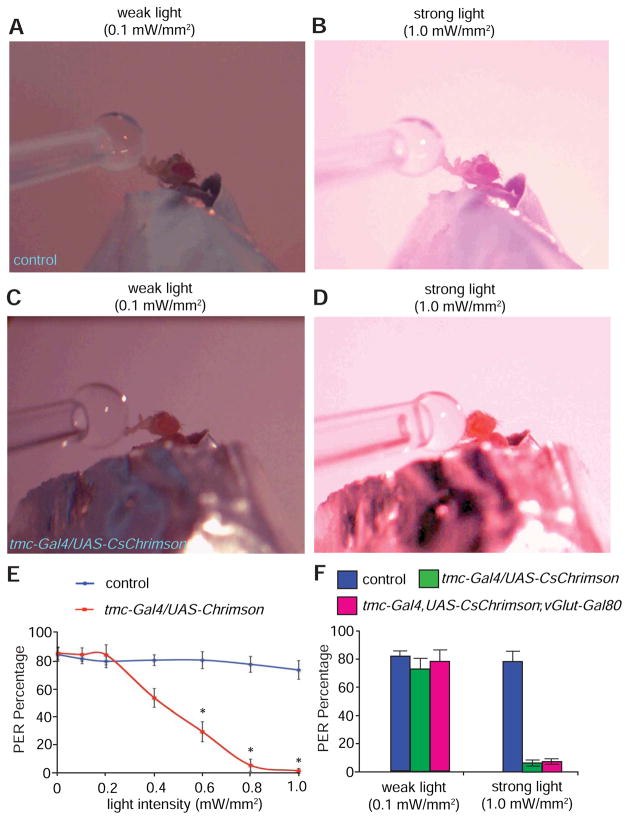
Figure 8. Differential modulation of sucrose feeding with varying intensities of light.
(A and B) PERs displayed by a control fly presented with 500 mM sucrose solution under: (A) weak light stimulation (0.1 mW/mm2), and (B) strong light stimulation (1.0 mW/mm2).
(C) PER exhibited by a fly expressing tmc-Gal4,UAS-CsChrimson presented with 500 mM sucrose solution under weak light stimulation (0.1 mW/mm2).
(D) No or minimal PER elicited by a fly expressing tmc-Gal4,UAS-CsChrimson presented with 500 mM sucrose solution under strong light stimulation (1.0 mW/mm2).
(E) Relationship between the intensity of the stimulating light and PER percentages using the indicated flies. n≥15.
(F) Percentages of flies of the indicated genotypes showing PERs in response to weak (0.1 mW/mm2) or strong light stimuli (1 mW/mm2). n≥15. The error bars indicate SEMs. *p<0.05. ANOVA tests with Scheffé’s post-hoc analysis.

