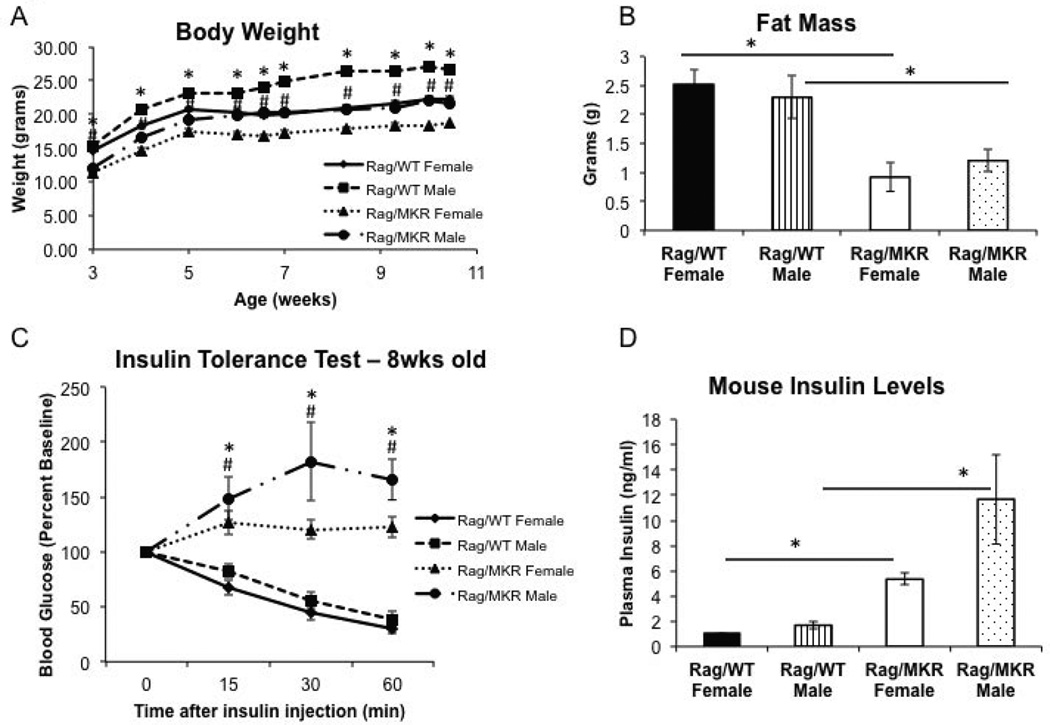
Figure 1.
Characterization of an immunodeficient hyperinsulinemic mouse model. (A) Body weights of male and female mice from Rag/WT and Rag/MKR mice, measured weekly from 3 weeks of age to 10 weeks of age. * p<0.05 between Rag/WT male and Rag/MKR male mice. # p<0.05 between Rag/WT female and Rag/MKR female mice. N=5 mice per group, error bars represent SEM. (B) MRI results showing whole body fat in Rag/WT and Rag/MKR mice. N=5 mice per group, error bars represent SEM. (C) Insulin Tolerance Test (ITT) performed on fasted 8 week male and female Rag/WT and Rag/MKR mice. Blood glucose levels were measured at time 0 and 15, 30, and 60 minutes post insulin injection. Mice were injected with 0.75U/kg insulin. * p<0.05 between Rag/WT male and Rag/MKR male mice. # p<0.05 between Rag/WT female and Rag/MKR female mice. N=5 mice per group, error bars represent SEM. (D) Plasma insulin levels of non-fasted male and female Rag/WT and Rag/MKR mice. * p<0.05 between groups as indicated. Graphs represent the mean of each group (n=5 mice per group), error bars are SEM.

