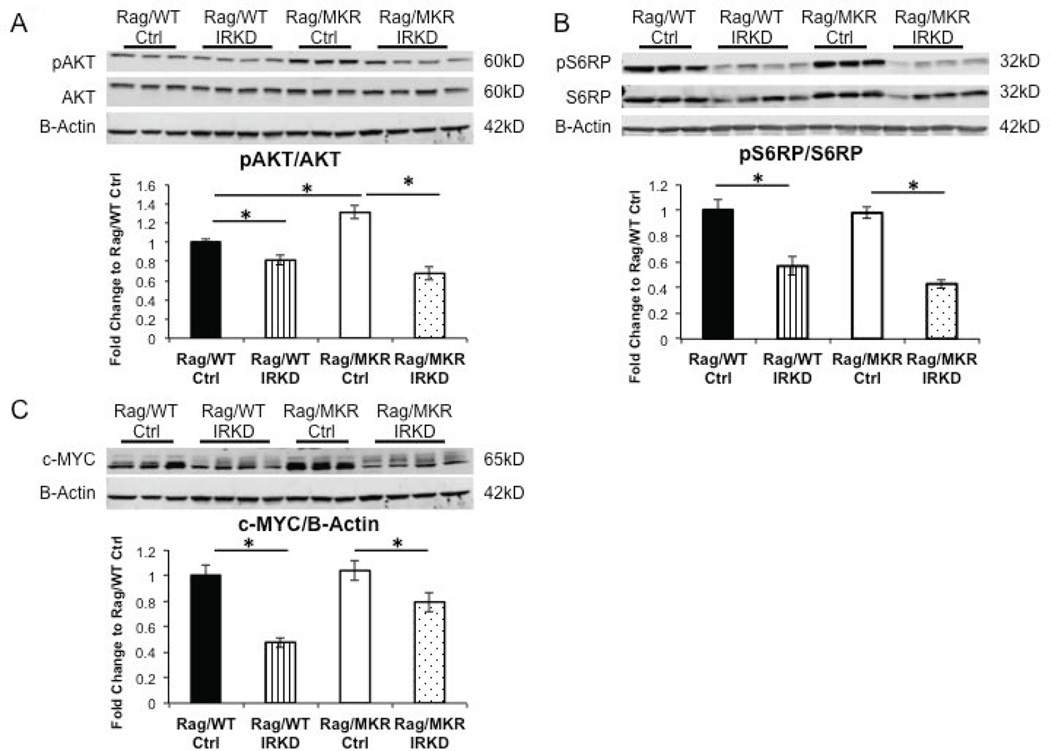
Figure 4.
Reduction of insulin signaling pathway in LCC6 IRKD tumors. (A) Representative blots showing protein extracted from tumor tissue and analyzed by Western blot for phospho-Akt (pAKT) and total AKT expression. B-Actin antibody used as loading control. Densitometry of Western blot (* p<0.05, graphs represent mean per group (n=8–10 mice per group) and error bars represent SEM). (B) Representative blots showing protein extracted from tumor tissue and analyzed by Western blot for phospho-S6 ribosomal protein (pS6RP) and total S6RP expression. B-Actin antibody used as loading control. Densitometry of Western blot (* p<0.05, graphs represent mean per group (n=8–10 mice per group) and error bars represent SEM). (C) Representative blots showing protein extracted from tumor tissue and analyzed by Western blot for c-MYC expression. B-Actin antibody was used as the loading control. Densitometry of Western blot of c-MYC/B-Actin (* p<0.05, graphs represent mean per group (n=8–10 mice per group) and error bars are SEM).

