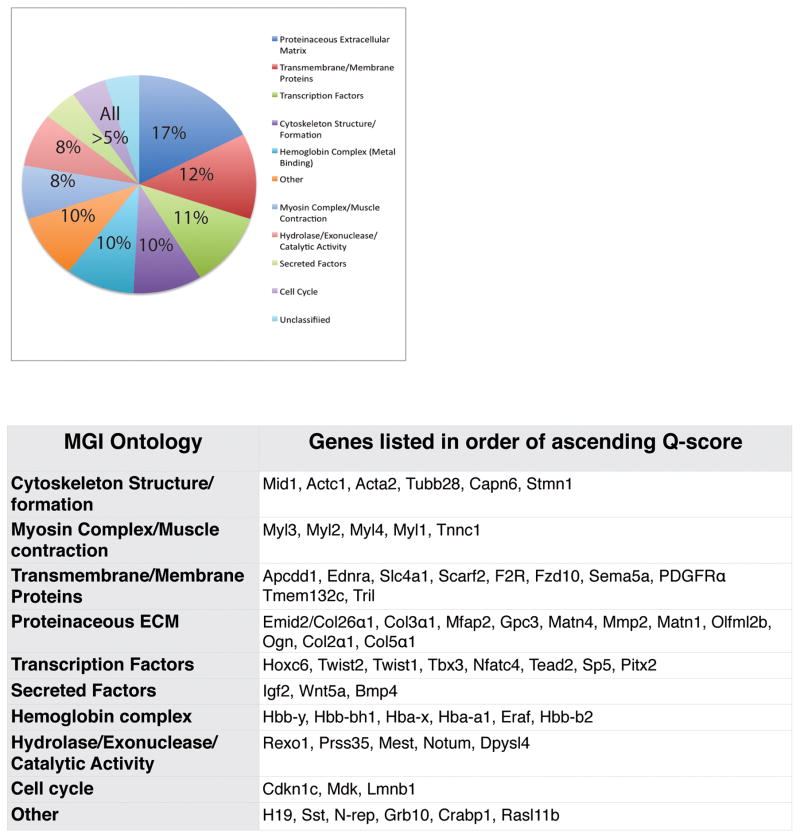
Figure 1. Characterization of E12.5 mouse dermal fibroblast gene expression signature determined by Shannon Entropy analysis.
Genes with fold-change associated Q scores less than 9.25 were clustered into basic ontologies using Mouse Genome Informatic (MGI) batch query tool. Genes are listed in order of ascending Q score in each category.

