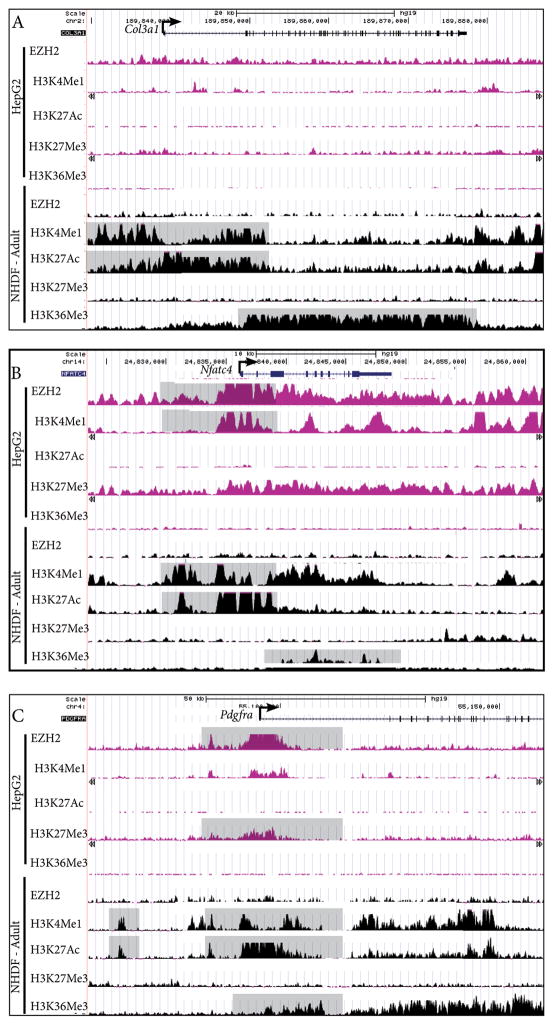
Figure 4. Putative regulatory regions for dermal fibroblast gene expression.
ChIP-seq profiles of histone modifications and EZH2 binding in human dermal fibroblast (HDF) and liver cell (HepG2) lines at Collagen3a1, Nfatc4, and Pdgfrα loci (A–C). Y-axis values range from 0–50, and refer to a relative value of signal enrichment for each region of interest. Data were visualized using the UCSC Genome Browser. Putative transcriptional active regions are associated with H3K4me1, H3K27Ac, and H3K36Me3. Transcriptional repression is associated with EZH2 binding and H3K27me3 at the TSS.

