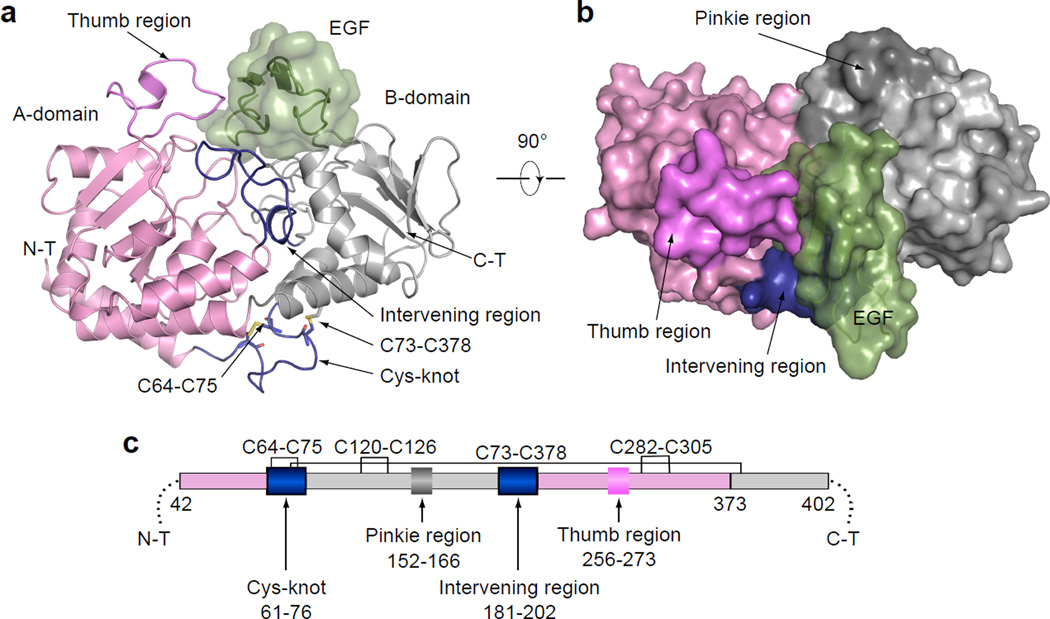
Figure 1. Overall structure of dRumi complexed with hFA9 EGF repeat.
a, Ribbon diagram of dRumi–EGF binary complex. Rumi A-domain is shown in pink, B-domain in grey, the Intervening linkage region and cys-knot connecting A- and B-domain in blue, the Thumb region in violet, and the Pinkie region in dark grey. The EGF is in dark green. b, Surface representation of the binary complex viewed from the top. c, Schematic of the domain organization of dRumi.

