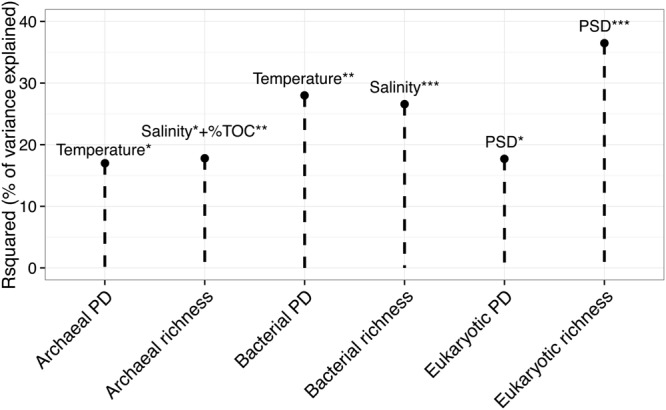
FIGURE 3.

Multiple linear regression model of richness and phylogenetic diversity (PD) of the three kingdoms (x-axis) against the set of explanatory variables. The y-axis represents the determination coefficient (r-squared). Only significant regressions are shown. Asterisk corresponds to the level of significativity: ∗p < 0.05, ∗∗p < 0.01, ∗∗∗p < 0.001.
