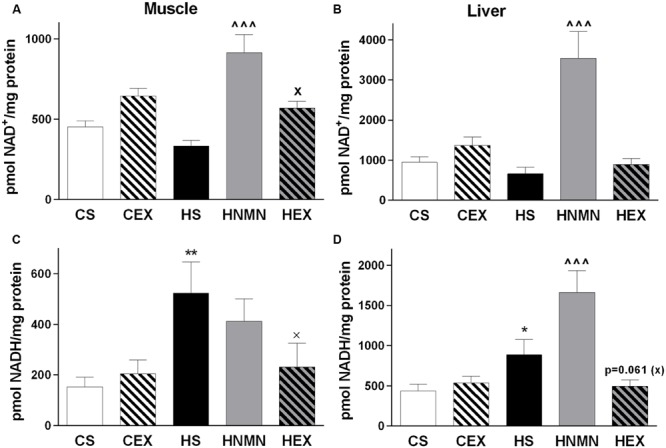
FIGURE 4.

NAD+(A) and NADH (B) content (pmol/mg protein) of quadriceps muscle and liver (C,D) of CS, CEX, HS, HNMN, and HEX mice. Data are shown as mean ± SEM (n = 6–8/group). Data were analyzed by one way ANOVA followed by LSD post hoc test. *P < 0.05, **P < 0.01 significant difference HS compared to CS. ∧∧∧P < 0.001 significant difference HNMN compared to HS. XP < 0.05 significant difference HEX compared to HS.
