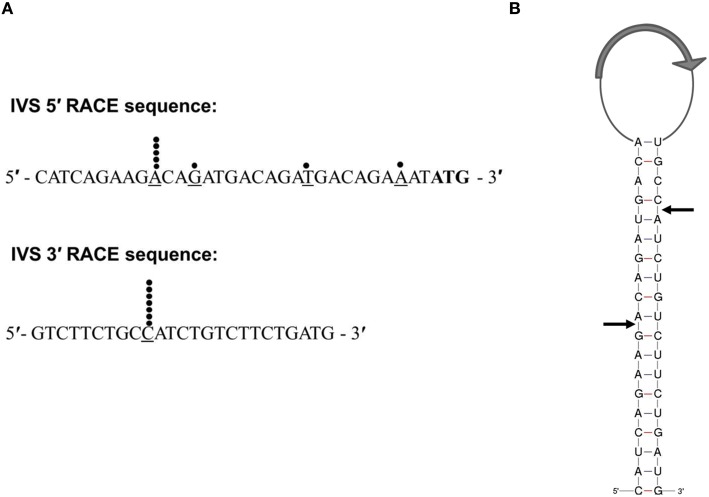
Figure 3.
Characterization of IVS termini by 5′- and 3′-RACE analysis. (A) Sequences of the 5′ and 3′ ends of the IVS are shown. Black dots indicate the last base (underlined) in an individual sequence analysis of a cloned RACE PCR product. The predicted start codon of the S23p ORF is shown in bold font. (B) Schematic representation of RNase III processing sites on the stem of the IVS RNA of C. burnetii (RSA 493). Black arrows indicate processing sites as determined by 5′- and 3′-RACE analyses. The relative location of the S23 ORF (CBU_2096) is indicated by a large gray arrow in the loop.

