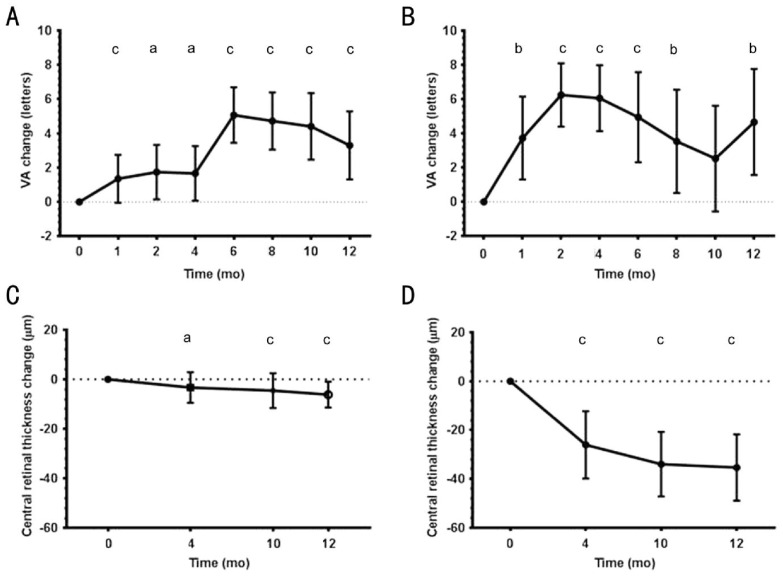
Figure 2. Mean ETDRS letter visual acuity changes.
Acuity changes shown over 12mo from time of first aflibercept treatment for A) poorly responsive patients switched to aflibercept, B) treatment-naïve patients. Corresponding change in central retinal thickness over 12mo from time of first aflibercept treatment for C) poorly responsive patients switched to aflibercept, D) treatment-naïve patients. VA: Visual acuity; SD: Standard deviation; CI: Confidence intervals. Significance are shown (aP<0.05, bP<0.01, cP<0.001).

