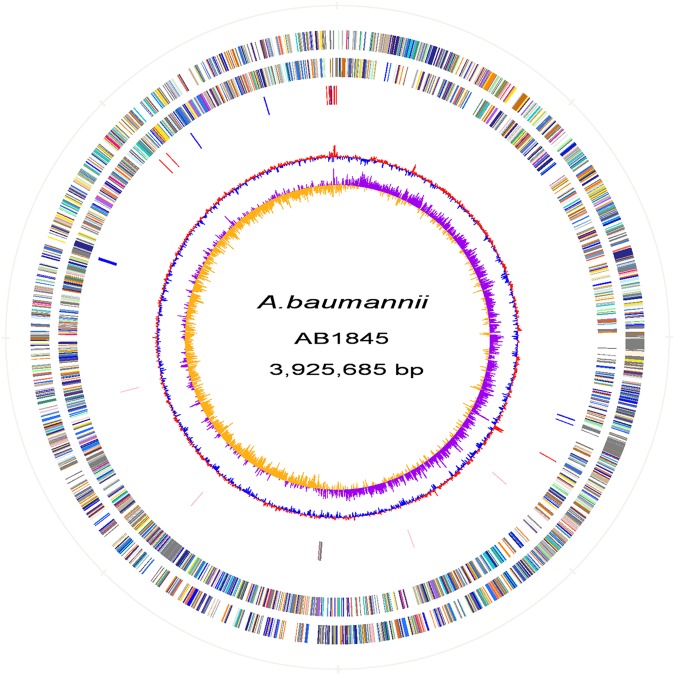
FIGURE 3.
Atlas of the A. baumannii AB1845 draft genome. Each concentric circle represents the genomic data for AB1845. The two outer circles illustrate the predicted coding sequences on the plus and minus strands, respectively, colored by functional categories according to the COG classification. The third circle represents the location of the nucleotide substitution between AB1845 and AB2092, with blue representing genes affected by synonymous Single Nucleotide Polymorphisms (SNPs) and red representing SNPs in the intergenic region. The fourth circle displays the loci of the β-lactamase genes (pink) and genes around blaOXA-23 (gray). The fifth circle shows the GC content, and the 6th circle (innermost) represents GC skew (G–C)/(G+C) calculated using a 1-kb window.

