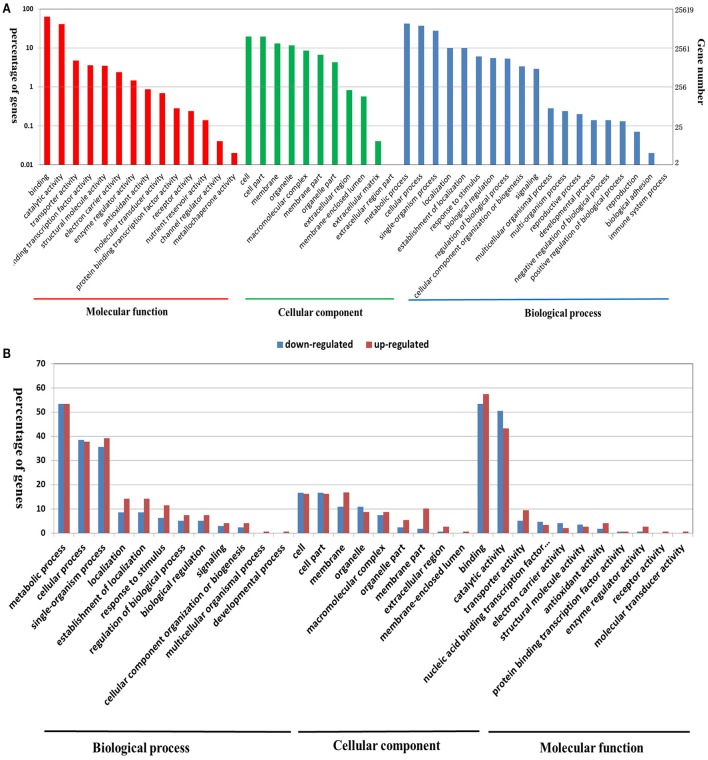
Figure 2.
Functional annotation of all of the detected genes in B. napus PRs (A), and DEGs between the two PR groups (B) based on GO classification. The results are summarized under three top-level ontologies: biological process, molecular function, and cellular component. The left y-axis indicates the percentage of a specific GO category in that main category. The right y-axis indicates the annotated gene number expressed in a given sub-category. The downregulated DEGs are represented by blue, and the upregulated DEGs are represented by red.

