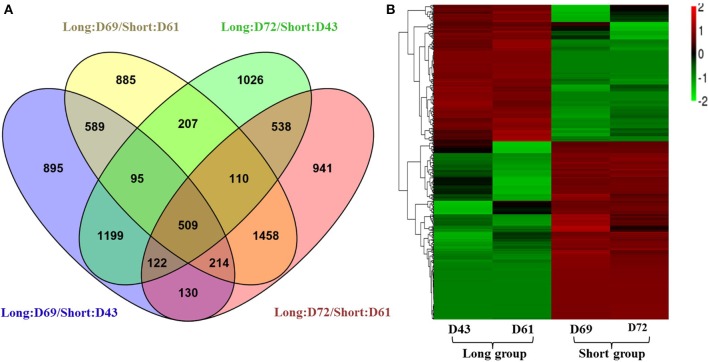
Figure 4.
Expression analyses of differentially expressed genes (DEGs). (A) A Venn diagram showing the DEGs between two individuals from different PR groups (D69 and D43, D69 and D61, D72 and D43, and D72 and D61), and the overlapping DEGs among the four comparisons. (B) Hierarchical cluster analysis of 509 DEGs using normalized FPKM values. Red represents upregulated genes, and green indicates downregulated genes. For the normalization, the FPKM value of a DEG in each library first minuses the average FPKM value of the DEG in the four libraries; then divided by the FPKM standard deviation f the DEG in the four libraries. The final normalized FPKM values were range from −2 to +2.

