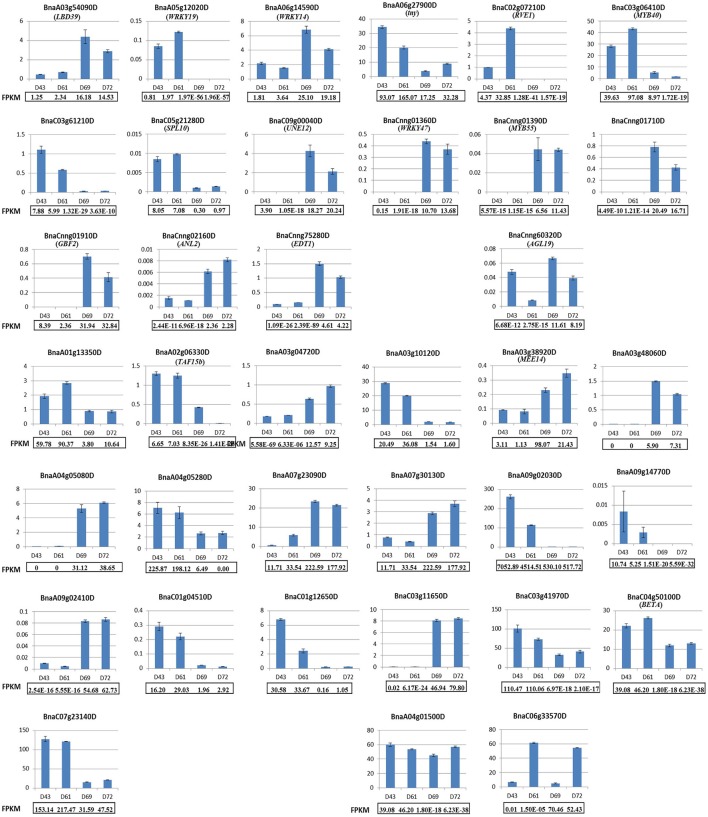
Figure 5.
Validation of 16 differentially expressed putative TFs and 21 randomly chosen DEGs by qRT-PCR. The top three rows display the qRT-PCR results for 16 differentially expressed putative TFs. The last four rows display the qRT-PCR results for 21 randomly chosen DEGs. All of the genes except for BnaCnng60320D, BnaA04g01500D, and BnaC06g33570D exhibited consistently expressed patterns between qRT-PCR and RNA-seq analyses. The relative mRNA levels of the three biological replicates were calculated using the 2−ΔΔCT method. The gene name for the selected DEG was shown in the parenthesis if it has been annotated by BLASTN in Arabidopsis.

