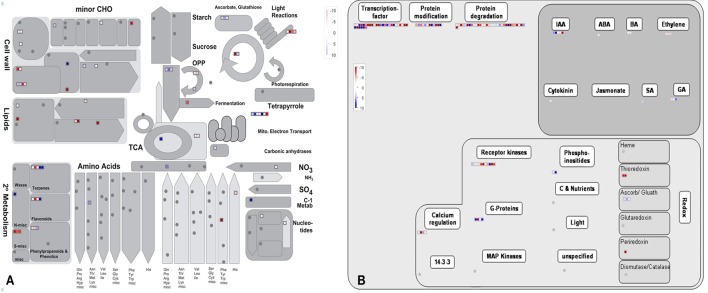
Figure 6.
The MapMan overview of cellular metabolism (A) and regulation (B) showing the DEGs those are responsible for PRL differences. Individual genes are represented by small squares. The color key represents the average counts of log2 fold-change between the short and long PR groups. Red represents upregulation and blue represents downregulation between two PR groups.

