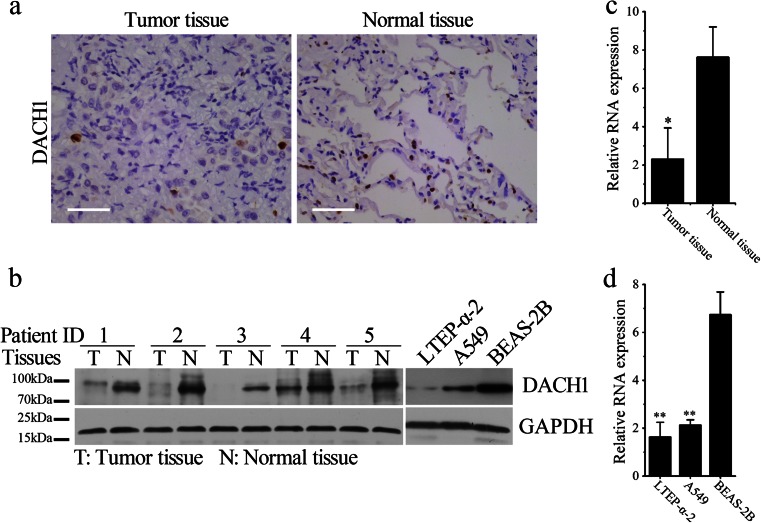
Fig. 1.
Decreased DACH1 expression in lung cancer tissues and cells. a Representative photos of immunohistochemistry for DACH1 in pairs of lung cancer tissues and adjacent non-tumor tissues (scale bar 50 μm). b Left panel: representative photos of Western blotting for DACH1 in pairs of lung cancer tissues and adjacent non-tumor tissues. Right panel: Western blotting analysis for DACH1 expression in LTEP-α-2, A549, and BEAS-2B cells. c–d Relative levels of DACH1 in normal and malignant tissues (c) and cells (d) by real-time PCR analysis. Data are shown as mean ± SEM, *p < 0.05, **p < 0.01

